3.5 Modelling skills
Graphical modelling
System dynamics1 has led to a graphical modelling language, in which relationships between quantities can be modelled.
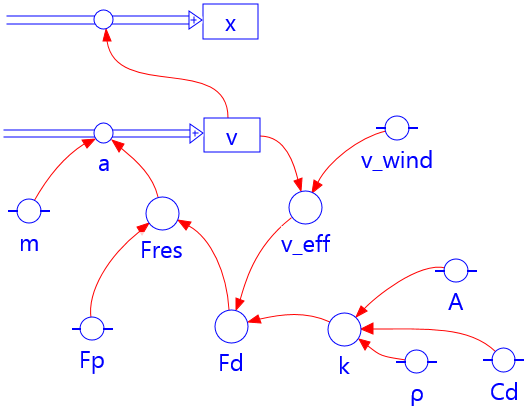
Fig 3.10 A graphical model in Coach 7
A model is built-up from a number of fixed elements in a graphical representation. Below we describe these elements as they appear in the Coach2 modelling environment:
- State variables: the rectangular boxes can be regarded as a certain 'stock' or 'quantity' that can increase and decrease, for example, an amount of energy, a distance to a zero point, or a number of particles (say in case of radioactive decay).
- Flow variables: these variables indicate how much a 'stock' increases or decreases per time step. In the above examples, that is how many Joules, meters or particles are added to or subtracted from the state variables in one time step.
- Auxiliary variables: all variables whose change can be represented by a direct relation are indicated by a circle. For example, electrical power (directly dependent on current and voltage), the acceleration (depending on the resultant force and mass), and the activity of the source (depending on the number of particles and the half-life).
- Relation arrows: these arrows indicate how a certain auxiliary variable or flow variable is calculated by means of other state variables or auxiliary variables.
- Constants: a variable that does not change during the execution time of the model is indicated by a circle with two extra line segments on each side.
The Coach program automatically generates the corresponding difference equations based on the graphical model. However, the equations for the auxiliary variables and flow variables must be entered manually. Because the number of building blocks is limited, it is easier for students to construct a model. It is also easier to see at a glance how various variables are interrelated. The state variables and the processes of change are clearly recognizable, and for each quantity it is indicated what it depends on.
With these building blocks, students can quickly get started and after a short learning time they can even construct and interpret relatively advanced models in some cases. On the other hand, it also appears that a group of students does not see through the formal meaning of the model symbols, partly because the metaphor of stock-and-flows offers an insufficient conceptual basis. It is therefore important that the relationship between the equations and the corresponding graphical structures is made clear in the initial phase.3,4