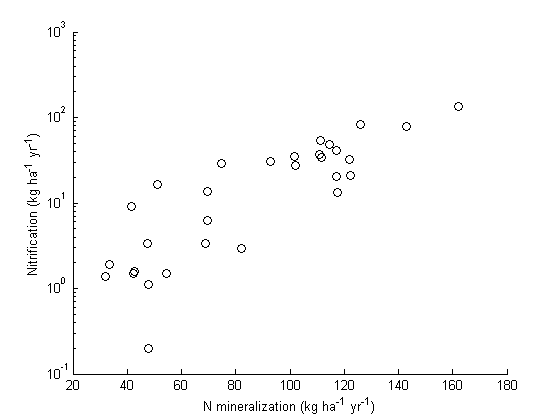
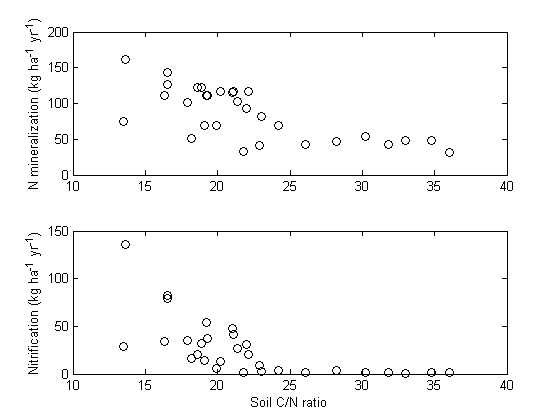
% regression_exercise.m

% Ollinger et al. (2002) measured various plant and soil characteristics
% (related to C and N processing) for 30 plots in the White Mountain National
% Forest, New Hampshire, USA. Part of their analyses were aimed at estimating
% the relationship between N mineralisation and soil C:N ratio and between
% nitrification and soil C:N ratio.
%
% Here we draw scatterplots for these two relationships.
% To see if there is any evidence for a nonlinear relationship.
%
% see:
%  Ollinger, S.V., Smith, M.L., Martin, M.E., Hallett, R.A., Goodale, C.L. &
%  Aber, J.D. (2002) Regional variation in foliar chemistry and N cycling
%  among forests of diverse history and composition. Ecology 83: 339-355.

% Headerline in file olinger02.csv:
% Plot,Species,History,FoliarN,Lignin,SoilCN,Nmineral,Nnitrif,FoliarLigN

fid = fopen('ollinger02.csv');
  data = textscan(fid, '%u%s%s%n%n%n%n%n%n','delimiter',',','Headerlines',1);
fclose(fid);

obsplot = data{1};
FoliarN = data{4};
Lignin = data{5};
SoilCN = data{6};
Nmineral = data{7};
Nnitrif	= data{8};
FoliarLigN = data{9};

% to reproduce fig. 3 from study by Ollinger et al. 2002
% drawing the regression line is left as an exercise
figure
plot(Nmineral,Nnitrif,'ko')
xlabel('N mineralization (kg ha^{-1} yr^{-1})')
ylabel('Nitrification (kg ha^{-1} yr^{-1})')
set(gca,'YScale','log')
box off

figure,
subplot(2,1,1), plot(SoilCN,Nmineral,'ko');
ylabel('N mineralization (kg ha^{-1} yr^{-1})')
subplot(2,1,2), plot(SoilCN,Nnitrif,'ko');
ylabel('Nitrification (kg ha^{-1} yr^{-1})')
xlabel('Soil C/N ratio')

% compare with fig. 4 in Ollinger et al.

% Fit a linear model relation between N mineralisation and soil C:N
% and nitrification to soil C:N ratio and examine the residuals.
% Again, is a nonlinear relationship suggested?


% Now fit a nonlinear, exponential, model of the form Y = ?*exp(?*X)
% to each data set. What are the parameter estimates (cf. Ollinger et
% al. p.343)? How much of the variation is explained by each model?