Data Size Plots
In the following sub sections results are displayed in the form of
RBUDP and multiple TCP bandwidth
plots as a function of the RBUDP data size. The bandwidth values are
presented with average values that are calculated in the areas with only
RBUDP, only TCP and with combined
RBUDP & TCP traffic types.
These flows are generated in the same way as described before in the
"Description" subsection. In
each plot the following plot traces are presented, entitled:
-
RBUDP (Only)
-
Contains the RBUDP bandwidth
results in the area with only this type of traffic.
-
UDT (& Iperf)
-
Contains the RBUDP bandwidth
results in the area where the
RBUDP & TCP traffic
types are combined.
-
Sum Iperf (Only)
-
Contains the sum over the TCP
Iperf flows in the area
with only this type of traffic.
-
Sum Iperf (& RBUDP)
-
Contains the sum over the TCP
Iperf flows in the area
with combined UDT &TCP
traffic types.
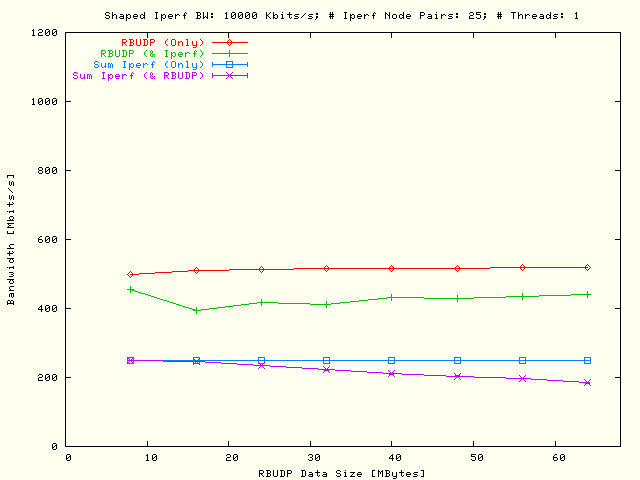
In the
plots of the average bandwidth values from the
RBUDP and / or TCP traffic
types listed above are presented as a
function of the RBUDP data size when
one threaded parallel flow per node pair has been used. The figures are
displaying the results of tests from 5 × 5 to
11 × 11 node pairs as usual grouped into two VLAN's where each
node is sending a TCP flow to all other participating nodes in the opposite
VLAN.
| . |
|
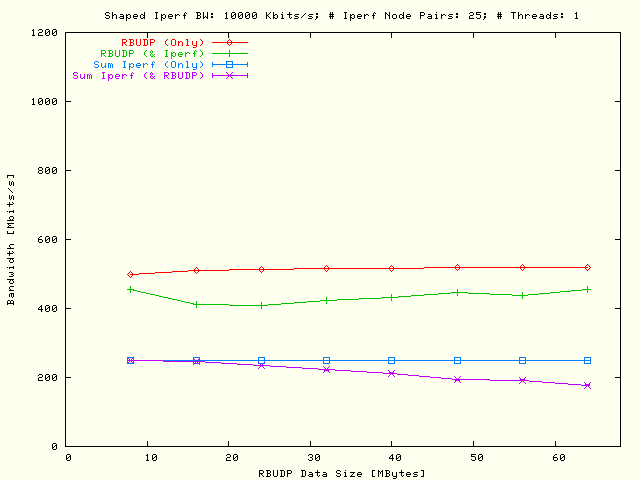
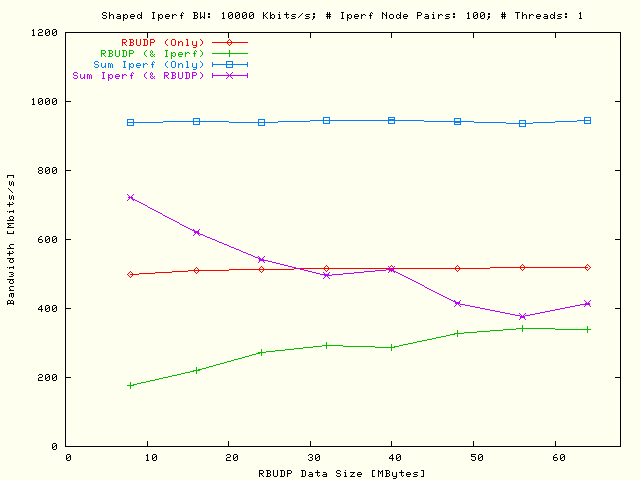
Single flow
RBUDP and multiple flows TCP
bandwidth as a function of the
RBUDP data size. In the left
plot the RBUDP flow has been
delayed and in the right plot the TCP flows which were defined by all
possible 5 × 5 node pairs, using one parallel flow per node
pair. |
| . |
|
Single flow
RBUDP and multiple flows TCP
bandwidth as a function of the
RBUDP data size. In the left
plot the RBUDP flow has been
delayed and in the right plot the TCP flows which were defined by all
possible 6 × 6 node pairs, using one parallel flow per node
pair. |
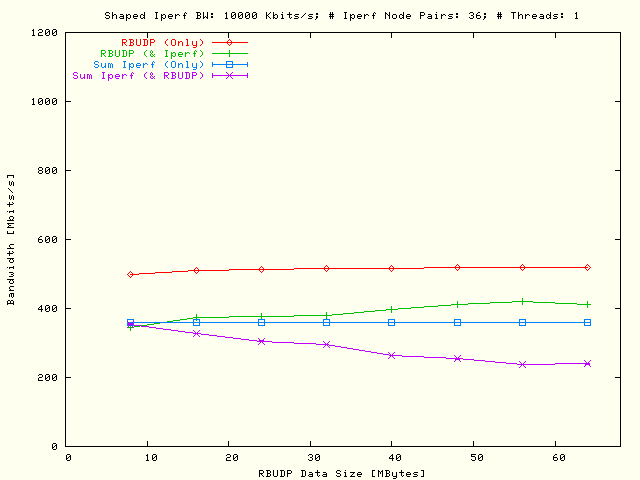
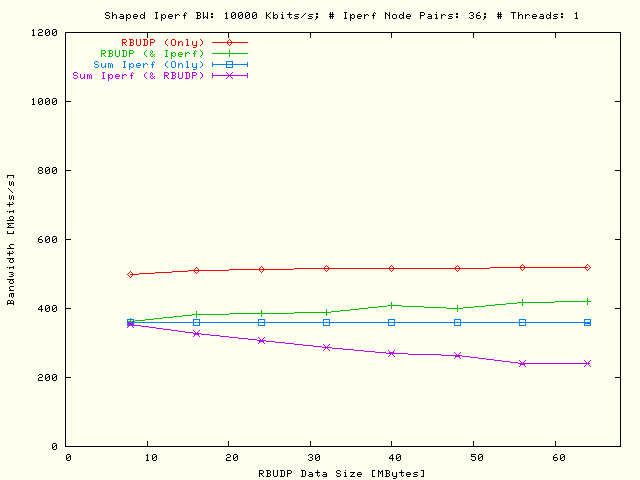
| . |
|
Single flow
RBUDP and multiple flows TCP
bandwidth as a function of the
RBUDP data size. In the left
plot the RBUDP flow has been
delayed and in the right plot the TCP flows which were defined by all
possible 7 × 7 node pairs, using one parallel flow per node
pair. |
| . |
|
Single flow
RBUDP and multiple flows TCP
bandwidth as a function of the
RBUDP data size. In the left
plot the RBUDP flow has been
delayed and in the right plot the TCP flows which were defined by all
possible 8 × 8 node pairs, using one parallel flow per node
pair. |
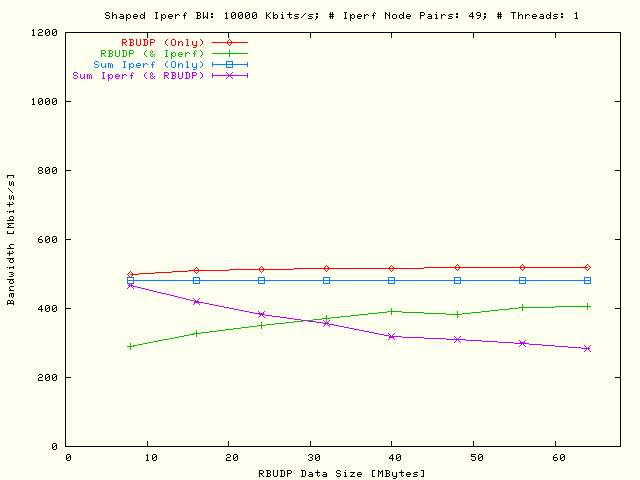
| . |
|
Single flow
RBUDP and multiple flows TCP
bandwidth as a function of the
RBUDP data size. In the left
plot the RBUDP flow has been
delayed and in the right plot the TCP flows which were defined by all
possible 9 × 9 node pairs, using one parallel flow per node
pair. |
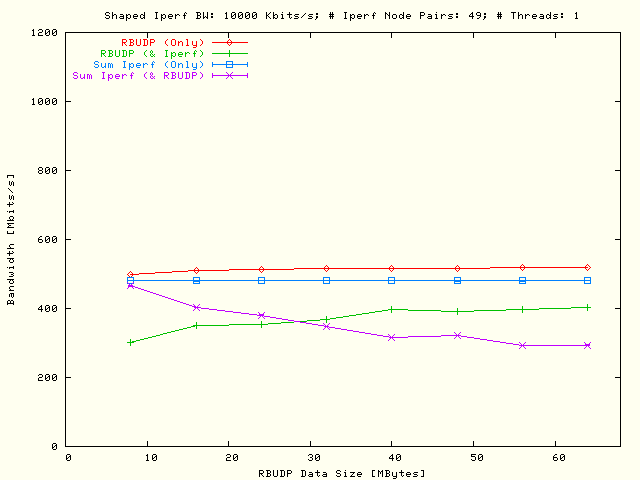
| . |
|
Single flow
RBUDP and multiple flows TCP
bandwidth as a function of the
RBUDP data size. In the left
plot the RBUDP flow has been
delayed and in the right plot the TCP flows which were defined by all
possible 10 × 10 node pairs, using one parallel flow per
node pair. |
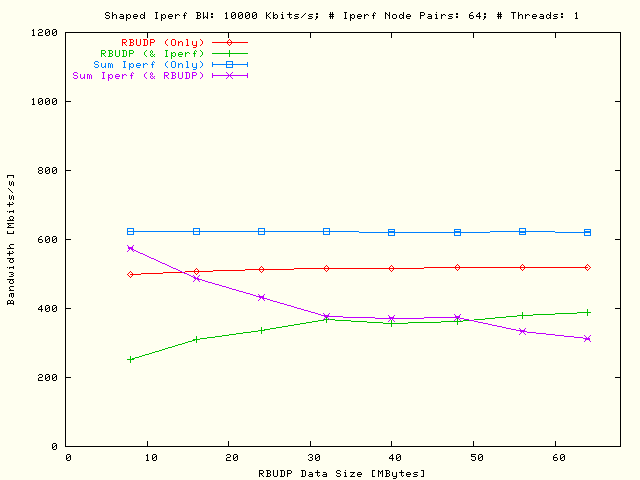
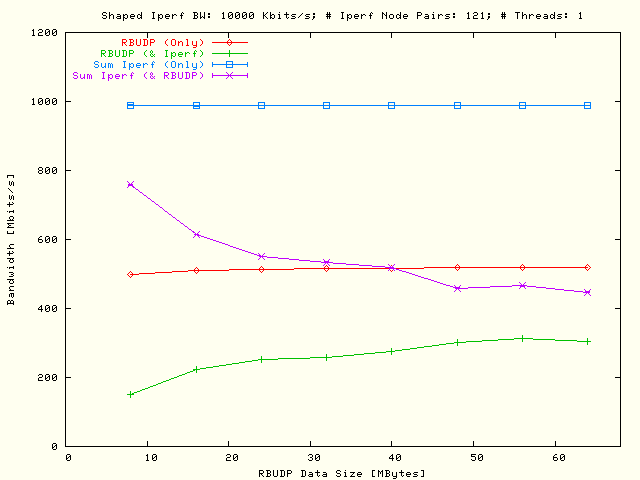
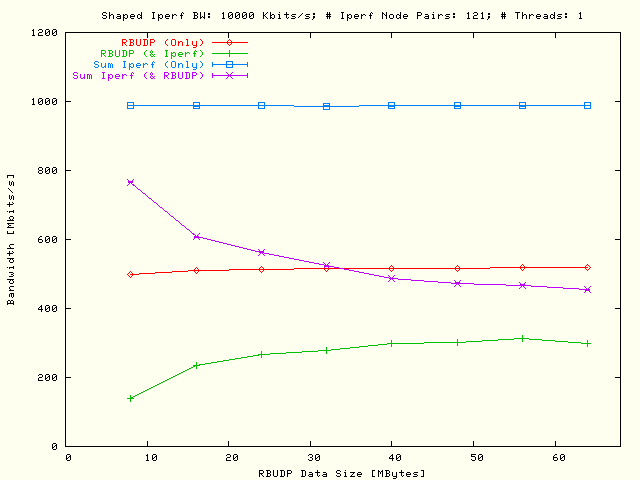
| . |
|
Single flow
RBUDP and multiple flows TCP
bandwidth as a function of the
RBUDP data size. In the left
plot the RBUDP flow has been
delayed and in the right plot the TCP flows which were defined by all
possible 11 × 11 node pairs, using one parallel flow per
node pair. |
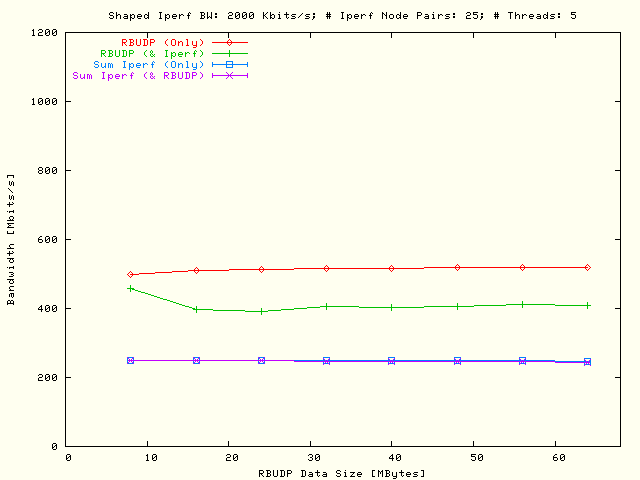
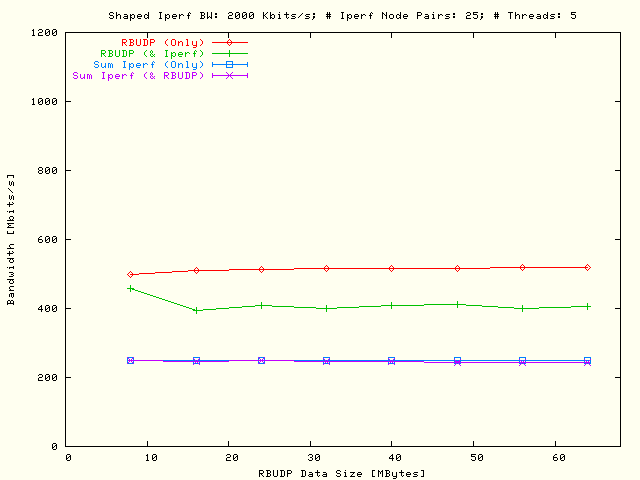
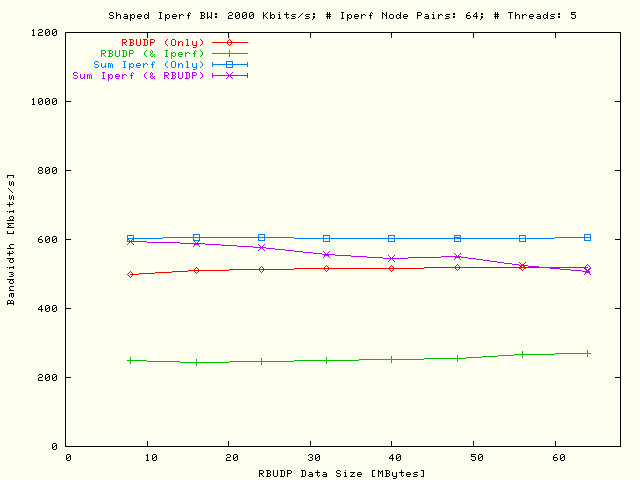
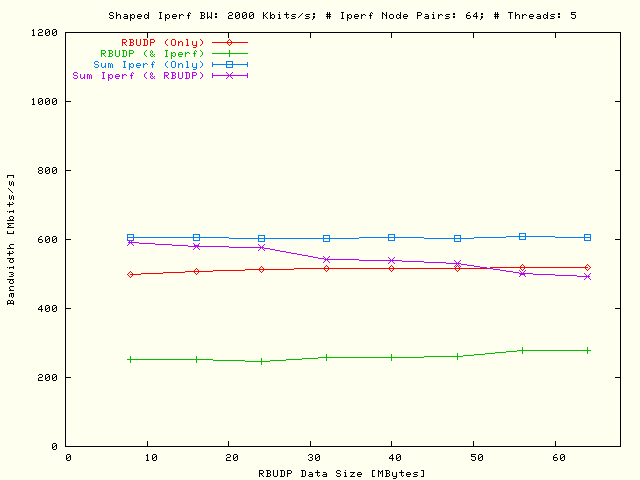
In the
equivalent results are displayed as in the
with the exception that there are now five threaded parallel TCP flows per node
pair used while in the previous situation only a single TCP flow per node pair
had been used with the constraint that the sum overall parallel flows per node
pair had been kept the same in both situations.
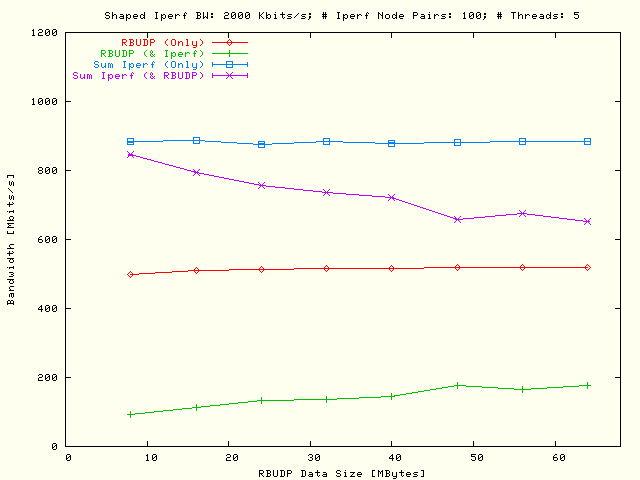
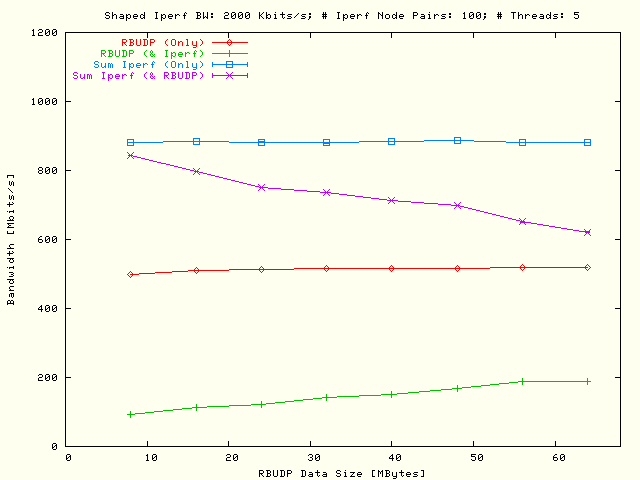
| . |
|
Single flow
RBUDP and multiple flows TCP
bandwidth as a function of the
RBUDP data size. In the left
plot the RBUDP flow has been
delayed and in the right plot the TCP flows which were defined by all
possible 5 × 5 node pairs, using five threaded parallel
flows per node pair. |
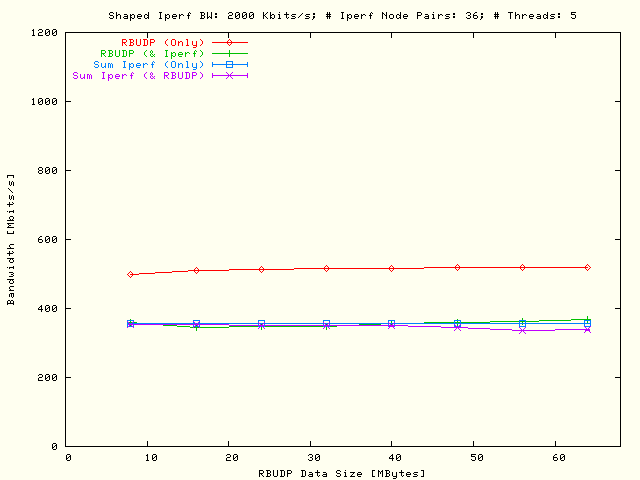
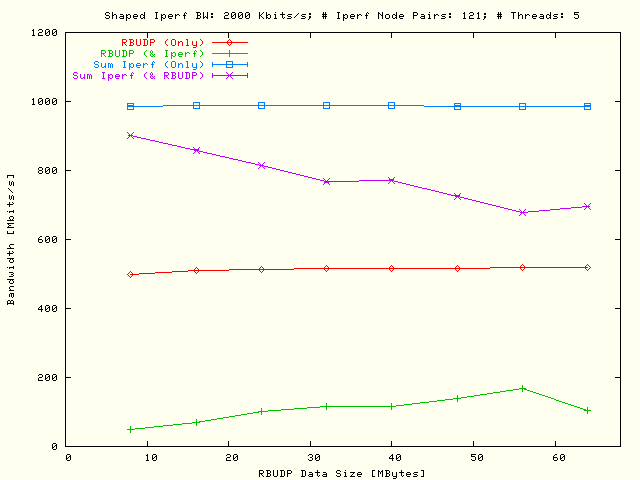
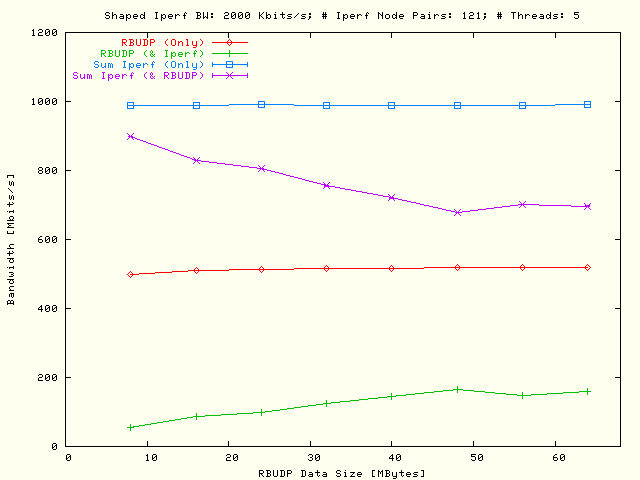
| . |
|
Single flow
RBUDP and multiple flows TCP
bandwidth as a function of the
RBUDP data size. In the left
plot the RBUDP flow has been
delayed and in the right plot the TCP flows which were defined by all
possible 6 × 6 node pairs, using five threaded parallel
flows per node pair. |
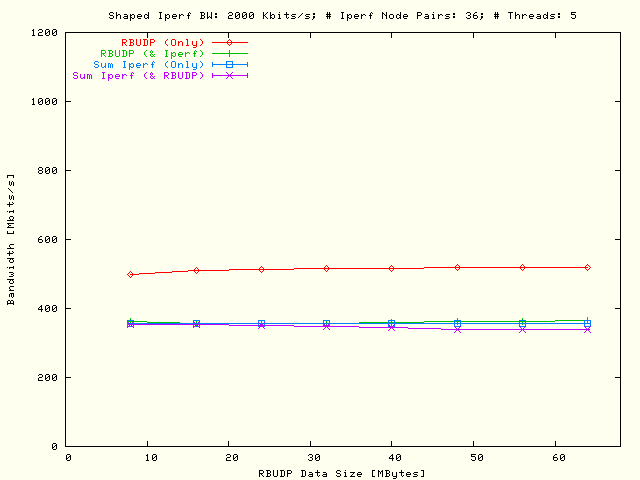
| . |
|
Single flow
RBUDP and multiple flows TCP
bandwidth as a function of the
RBUDP data size. In the left
plot the RBUDP flow has been
delayed and in the right plot the TCP flows which were defined by all
possible 7 × 7 node pairs, using five threaded parallel
flows per node pair. |
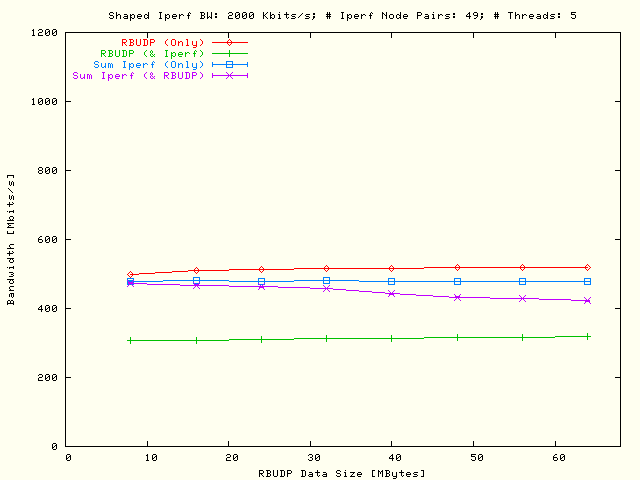
| . |
|
Single flow
RBUDP and multiple flows TCP
bandwidth as a function of the
RBUDP data size. In the left
plot the RBUDP flow has been
delayed and in the right plot the TCP flows which were defined by all
possible 8 × 8 node pairs, using five threaded parallel
flows per node pair. |
| . |
|
Single flow
RBUDP and multiple flows TCP
bandwidth as a function of the
RBUDP data size. In the left
plot the RBUDP flow has been
delayed and in the right plot the TCP flows which were defined by all
possible 9 × 9 node pairs, using five threaded parallel
flows per node pair. |
| . |
|
Single flow
RBUDP and multiple flows TCP
bandwidth as a function of the
RBUDP data size. In the left
plot the RBUDP flow has been
delayed and in the right plot the TCP flows which were defined by all
possible 10 × 10 node pairs, using five threaded parallel
flows per node pair. |
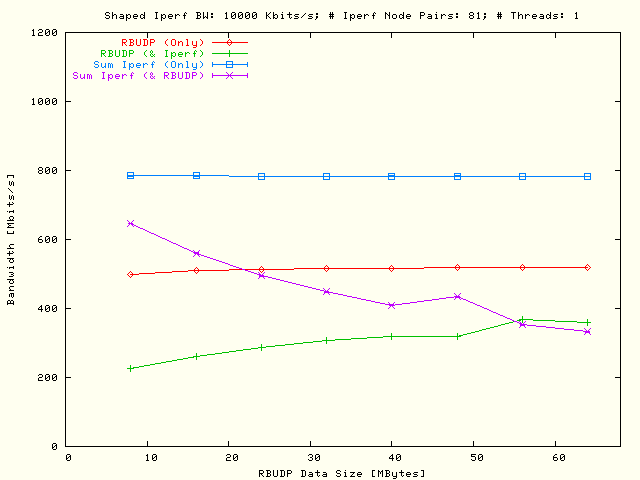
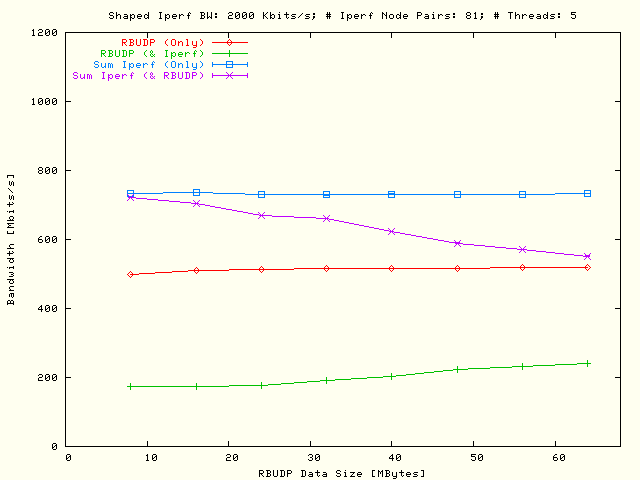
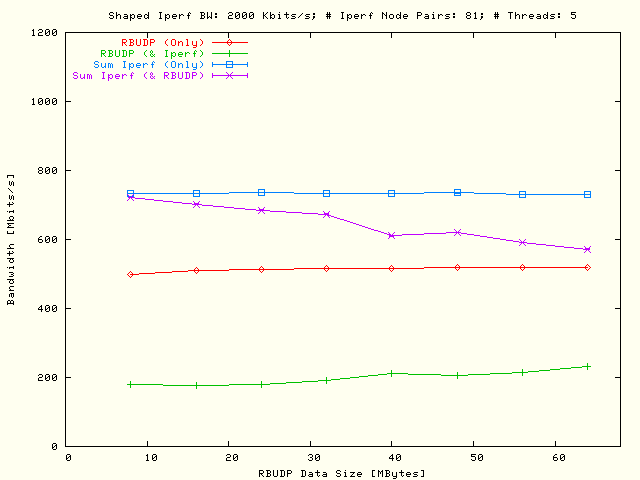
| . |
|
Single flow
RBUDP and multiple flows TCP
bandwidth as a function of the
RBUDP data size. In the left
plot the RBUDP flow has been
delayed and in the right plot the TCP flows which were defined by all
possible 11 × 11 node pairs, using five threaded parallel
flows per node pair. |
From the results in
the following conclusions can be drawn:
-
There is no significant difference in the results where the delay of the
RBUDP flows (left plots) are
compared with the delay of the TCP flows (right plots).
-
When there is only RBUDP type of
traffic, variation of the RBUDP
data size hardly has any influence. Probably the almost zero round-trip time
will be a reason for that.
-
In all plots their can be seen that the TCP
Iperf flows are limiting
the RBUDP flow: that is already
long before the 1 Gbits/s loop-back interface has been saturated.
-
With increasing RBUDP data size,
the influence of the TCP flows upon the
RBUDP flow will become less,
resulting at the area with combined traffic in an increasing
RBUDP bandwidth and a decreasing
TCP bandwidth when the RBUDP.
These slopes are getting steeper with increasing number involved TCP node
pairs, also with increasing total TCP bandwidth.
-
However with five parallel flows per node pair the influence of the TCP
flows upon the RBUDP flow is
stronger (see the previous sub section),
resulting in less steep slopes when the same number of TCP node pairs are
involved.