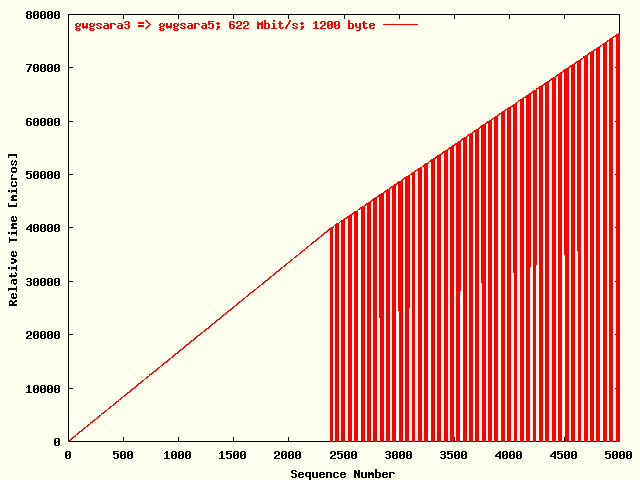
| The relative receiving time as function of the packet sequence number for the UDP stream gwgsara3 => gwgsara5. The packet size was 1200 byte. |
| <- | Overview Network Tools | | | ^ | Table of Contents | | | Network Monitoring Tools | -> |
In this section the proposed TCP and UDP performance test tools are described that has been used. In general these are programs written in the C language and / or C++. The tools, described in the following subsections, have been used. Also the modifications, when applied, are mentioned there.
The Netperf tool is in principle a TCP and UDP benchmark. However, no shaping algorithms have been implemented. Therefore, the value of the UDP test type is limited, because due to the lack of shaping, the sender will often overflow the receiver, because sending is more easier than receiving. In fact various TCP and UDP traffic types can be defined. See the manual for more information.
The Netperf toolkit consists of two components:
netserver
netperf
In fact netserver is a true server
in the sense that all relevant data should be specified via the
netperf client. This feature makes
netserver also suited to be
started from the Unix inetd net services daemon, such that in
principle all security features, supplied by the TCP wrapper tool, are
also in effect here.
Between the netserver daemon and
the netperf client always two
socket connections will be opened:
netserver options.
netserver daemon can be completely
controlled by the netperf client.
However, the disadvantage is that it is not possible to specify directly the
port of the data socket which may be for
instance a disadvantage for port-based TOS-bit settings.
When desired also IPv6 support can be enabled
during the Netperf
compilation. To be able to do this, it is required that the
getaddrinfo() system calls are supported at your system.
To Netperf Version 2.2p12 the most important following modifications have been executed:
getaddrinfo() have been
corrected. Otherwise at some platforms (a.o.
Linux) sometimes the program would
continue to run after failure of the getaddrinfo() call,
resulting in a segmentation fault. Please note that the
getaddrinfo() is only used when
IPv6 has been enabled.
netserver program usage
also the IPv6 related options have been
included, when enabled.
README_MOD in the archive.
After unpacking the tar-gzip archive the appropriate directives in the
makefile, contained in the archive should be edited. Concerning
these make directives, there is one remark to me made: the
netserver program uses a log file
that is defined in the LOG_FILE directive. Default that file is
located in the /tmp directory. However, that implies that one user
is blocking the usage of netserver
for all other users, because they are not allowed to overwrite the log file
opened by the first user. Therefore, a better strategy in this situation is to
use a user dependent log file. When used from inetd, the default
log file is fine.
In the following example a TCP stream test has been defined from host
gwgsara3 to host gwgsara2 with a duration of 10 seconds
and with 256 Kbyte socket and buffer sizes. The server is listening at
port 22113. All options besides the port option are specified at the
client. The socket and windows sizes options are stream type specific and should
therefore be specified after the argument --.
Start the server at host gwgsara2:
gwgsara2[12:06]~:110> netserver -p 22113
Starting netserver at port 22113
Start the client at host gwgsara3:
gwgsara3[12:06]~:104> netperf -H gwgsara2 -p 22113 -l 10 -- \
?                             -m 256K,256K -M 256K,256K \
?                             -s 256K,256K -S 256K,256K
TCP STREAM TEST to gwgsara2
Recv   Send    Send
Socket Socket  Message  Elapsed
Size   Size    Size     Time     Throughput
bytes  bytes   bytes    secs.    10^6bits/sec

524288 524288 262144    10.00     718.62
Also the Iperf tool is a TCP and UDP benchmark. Because shaping has been implemented in Iperf, the tool is also usable for UDP. A.o. other protocols also Multi-Cast has been supported. See also the User Docs for more information
In contradiction to
Netperf, the
Also the Iperf toolkit
consist of a combined server / client program named
iperf. This implies that, in
contradiction to
Netperf, the
server site options should be specified directly to the server version of the
program. All server oriented output will not send back to the client either, but
remain at the server console. This also implies that only a test socket will be
opened and no control socket.
This approach has the advantages that:
However, there are also some disadvantages:
iperf server process, listening at
a private port should be used.
Iperf also supports the following features that Netperf does not have:
pthread library can be used to generate multiple
streams between the same source and destination hosts. This is a more
lightweight method than starting multiple processes that should be used with
Netperf. The
results is less consumption of system resources.
To Iperf Version 1.7.0 (with IPv6 support) a.o. the following changes have been made from which some are extensions of the functionality and others are bug fixes:
README_MOD in the archive. Also the modified
V. 1.6.2,
V. 1.6.4 and
V. 1.6.5 are still
available from here.
In the following example a TCP stream test has been defined from host gwgsara3 to host gwgsara2 with a duration of 10 seconds and with 256 Kbyte socket and buffer sizes. The server is listening at port 22113. The server options should be specified here also at the server. Also the output is listed at the server host gwgsara2.
Start the server at host gwgsara2:
gwgsara2[17:46]~:101> iperf -s -p 22113 -l 256K -w 256K
------------------------------------------------------------
Server listening on TCP port 22113
TCP window size:  512 KByte (WARNING: requested  256 KByte)
------------------------------------------------------------
[  6] local 145.146.0.1 port 22113 connected with 145.146.0.2 port 41871
[ ID] Interval       Transfer     Bandwidth
[  6]  0.0-10.0 sec   882 MBytes   740 Mbits/sec
Start the client at host gwgsara3:
gwgsara3[17:46]~:101> iperf -c gwgsara2 -p 22113 -l 256K -w 256K
------------------------------------------------------------
Client connecting to gwgsara2, TCP port 22113
TCP window size:  512 KByte (WARNING: requested  256 KByte)
------------------------------------------------------------
[  3] local 145.146.0.2 port 41871 connected with 145.146.0.1 port 22113
[ ID] Interval       Transfer     Bandwidth
[  3]  0.0-10.0 sec   882 MBytes   739 Mbits/sec
The UDPmon toolkit consists of several programs used for investigating the end-to-end performance of networks. The programs use the socket interface in a simple way and do not require root privileges. They are usually used in server - client pairs.
For our set of network test tools we are especially interested in the
udp_bw_resp /
udp_bw_mon combination which
gives and estimate of the bandwidth found in the route between two end nodes,
using a large number of UDP packets.
Below a citation follows from the description of the UDP bandwidth measurements by R.E. Hughes-Jones where the functionality of these two programs has been explained.
With these two programs the bandwidth of the bottleneck, or the network section that limits the bandwidth in the route between the test nodes may be determined by measuring the times taken to send and receive a burst of frames send from a requesting node to a responding node.
The test uses UDP/IP frames. The tests starts with the requesting node sending a "clear statistics" message to the responder. On reception of the OK acknowledgment, the requesting node sends a series of "data" packets separated with a given fixed time interval between the packets. At the end, the requesting node asks for the statistics collected by the responding node. Packet loss for the control messages are handled by suitable time-outs and retries in the requesting node. The transmit throughput is found using the amount of data sent and the time taken; the receive throughput is calculated from the amount of data received and the time from the first data packet to the last data packet received.
Packet loss is measured by the remote or responding node by checking that sequence numbers in the packets increase correctly, this also detects out-of-order packets. The numbers of packets seen, the number missed as indicated the sequence number check, and the number out-of-order are reported at the end of each test.
So far the citation.
To the udp_bw_resp and
udp_bw_mon programs from the
UDPmon toolkit, some
modifications have been add that will also partly be supported in future
releases:
udp_bw_resp as a real Unix
daemon in the sense that:
/) to do not block mounted
file systems.
/dev/null.
| Sequence number | - | Relative time difference to the first packet |
The current distribution can be downloaded from the UDPmon site, maintained by R.E. Hughes-Jones.
The characteristics contained in the time-stamp information can be nicely demonstrated in graphical form. In the plot listed below, the receiving time relative to the first packet has been plotted as function of sequence number of the packet for 5000 UDP packets from host gwgsara3 to host gwgsara5. The packet size was 1200 byte. When a packet got lost its receiving time was set to zero. From this plot there follows that about the first 2400 packets have been received without lost, while the linear line is indicating that these packets were arriving with about the same relative arrival time after the previous packets. After the first 2400 packets there were packets getting lost, presumably because the critical available amount of memory in the network could not buffer the packets anymore. In the document, from which the plot below has been taken, this property has been used to make an estimation of this critical available amount of network equipment memory.
| The relative receiving time as function of the packet sequence number for the UDP stream gwgsara3 => gwgsara5. The packet size was 1200 byte. |
| <- | Overview Network Tools | | | ^ | Table of Contents | | | Network Monitoring Tools | -> |