Long Duration UDP Tests
Description
At November 4, 2002 long duration UDP bulk transfer tests
were performed in both directions between CERN
and StarLight. A modified
version of the
Iperf V. 1.6.2. has
been used to generate the traffic with most important adjustment the usage of
unsigned 64 bit counters in the place of the default unsigned 32 bit
variables. This was required to prevent counter overflows with these long
measurement times.
From the hosts available at that moment maximal three stream pairs could be
defined. In our tests the following stream pairs were used in both directions:
w01gva-ge-0 <-> w03chi-ge-1,
w05gva-ge-0 <-> w05chi-ge-1 and
w06gva-ge-0 <-> w06chi-ge-1, where the phrase
gva (chi) refers to an in
CERN, Geneva
(StarLight,
Chicago) located host. The test time was 3600 s with a periodic
bandwidth report each 20 s. The shaped sender bandwidth per stream was
700 Mbit/s. The packet size was 64 Kbyte.
Results
In the following figures the UDP receiver bandwidth and the percentage
datagrams lost have been presented as a function of the interval time. Each
individual stream is represented here by a plot trace. There also traces in the
corresponding plots for the total receiver bandwidth, summed over all streams,
and for the average percentage datagrams lost.
In
,
,
the UDP receiver bandwidth, respectively percentage datagrams lost, are
presented as a function of the interval time for the direction
Geneva -> Chicago. The respective
show these data for the reverse direction.
| . |
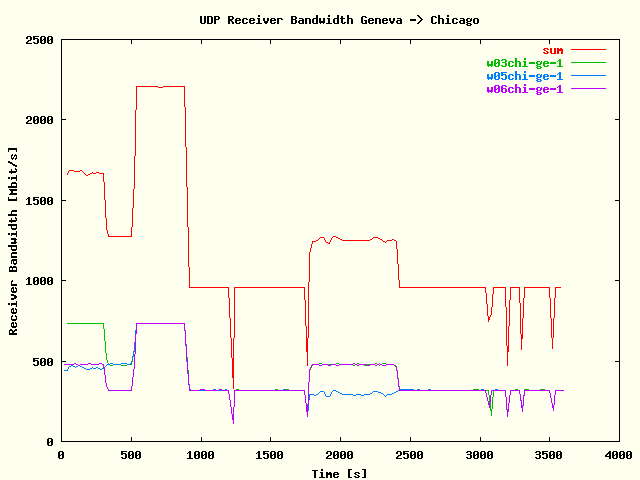
|
UDP receiver bandwidth for the direction
Geneva -> Chicago as a
function of the interval time. Plot traces are
representing the total bandwidth sum and the individual
stream results. |
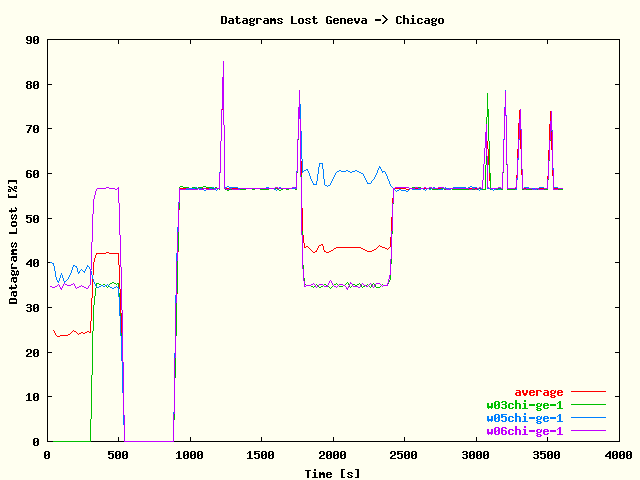
| . |
|
Percentage UDP datagrams lost for the direction
Geneva -> Chicago as a
function of the interval time. Plot traces are
representing the average percentage datagrams lost and
the individual stream results. |
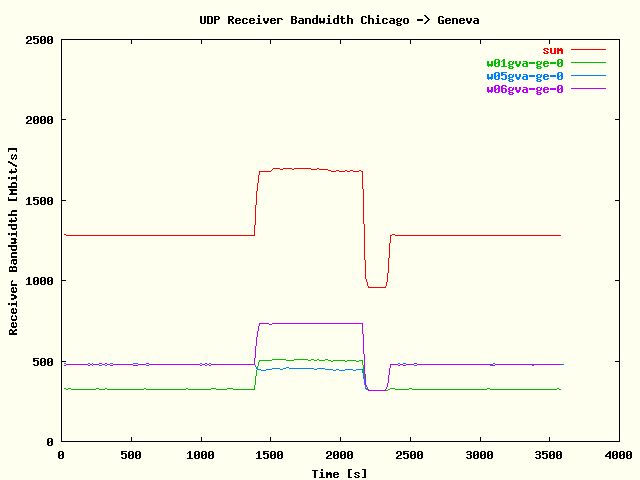
| . |
|
UDP receiver bandwidth for the direction
Chicago -> Geneva as a
function of the interval time. Plot traces are
representing the total bandwidth sum and the individual
stream results. |
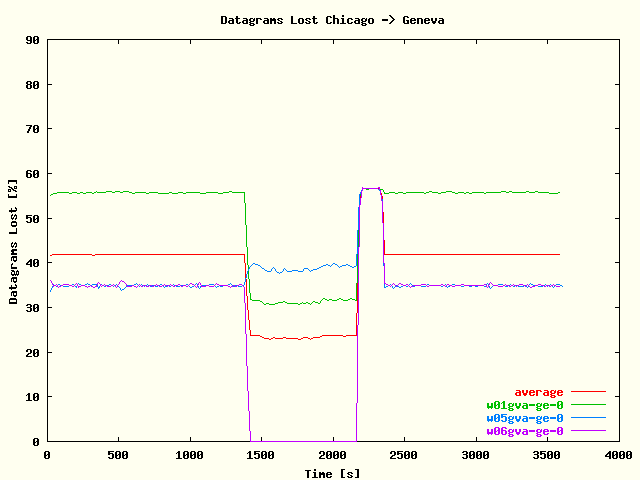
| . |
|
Percentage UDP datagrams lost for the direction
Chicago -> Geneva as a
function of the interval time. Plot traces are
representing the average percentage datagrams lost and
the individual stream results. |
Conclusions
From the
the following can be concluded:
-
The only interval without datagrams lost is found in the direction
Geneva -> Chicago with interval times from about
550 s to 900 s. Only in that range the theoretical expected
bandwidth sum of about 2100 Gbit/s could be reached. In all other areas
the percentage datagrams lost is around the 50%.
-
Globally spoken there is a strong correlation in the shape of the bandwidth
and datagram lost curves for the individual streams.
-
The previous points may be an indication that the dominant effects in the
bandwidth and datagram lost patterns are caused by the network equipment and
are no host effect. Otherwise it is difficult to explain why an area without
any major datagrams lost could be found
Long Duration TCP Tests
Description
Also at November 4, 2002 long duration, bi-directional TCP
bulk data transfer tests were executed, but in contradiction with the
UDP tests only one stream in the
direction w01gva-ge-0 <-> w03chi-ge-0. After these
tests it appeared that interface -ge-1 in Chicago was preferable,
because it had been used as default route to the Geneva hosts. Also here a test
time had been used of 3600 s with a periodic bandwidth report each
20 s. A TCP window size of 16 Mbyte had been used.
Results
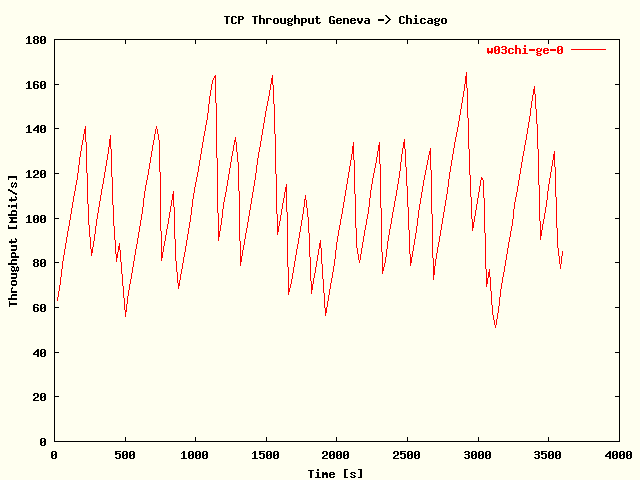
In the following figures the TCP throughput has been given as a
function of the interval time.
shows these data for the direction Geneva -> Chicago
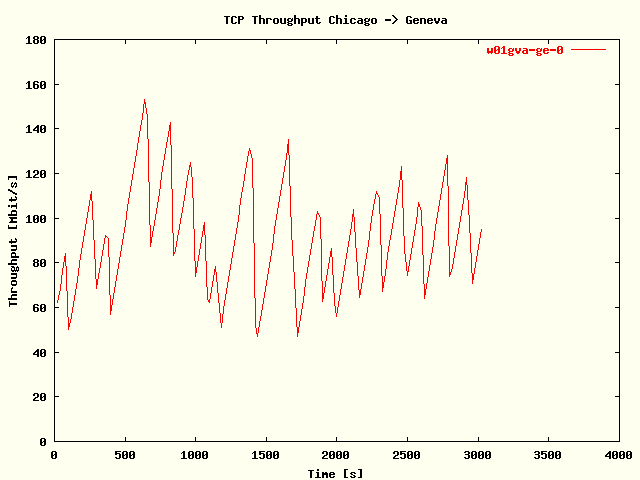
and
for the reverse direction.
| . |
|
TCP throughput for the direction
Geneva -> Chicago as a
function of the window size. |
| . |
|
TCP throughput for the direction
Chicago -> Geneva as a
function of the window size. |
Conclusions
From the
the following conclusions can be drawn:
-
In the direction Chicago ->Geneva the connection
breaks down after about 3020 s. with the
Iperf error message:
write failed: Connection reset by peer.
As no errors in the specified parameters for this direction could be found,
this might be an indication of a network error.
-
In both directions the usual pattern could be found for these long
round-trip times of growing throughput caused by a growing congestion
window, until the window is one or more times halved due to package lost or
another reason. Than the growing of congestion window manipulated by
congestion avoidance mode restarts.
-
The results found here are globally in correspondence with the
Netherlight throughput results.