Bandwidth Interval Plots
In the following sub-sections results are presented in the form of
RBUDP and TCP bandwidth plots as a
function of the absolute interval time of the network test which
implies that also the delay times are included at the interval times.
RBUDP Data Size and Shaped Bandwidth
Variation
In the
plots of the bandwidth interval reports from the
RBUDP and TCP flows are displayed as a
function of the absolute interval time of the network test, also with delay
times included. In the left plots the
RBUDP flow is delayed while in the
right plots the TCP flows are delayed. In the TCP plot trace the markers are
denoting the overall sum of the TCP flows. The standard deviation in the TCP
sum is denoted by the error bars representing the variation in the TCP bandwidth
values. These tests were executed with one parallel flow per node pair. There
were 11 node pairs used in each VLAN. Each node had been connected with all
nodes in the other VLAN, so 11 × 11 different TCP flows were
used. In the
these results are presented as a function of the
RBUDP data size with a shaped TCP
bandwidth of 5 Mbits/s per flow. Equivalent results are presented in
but here with a shaped bandwidth of 10 Mbits/s per flow.
| . |
|
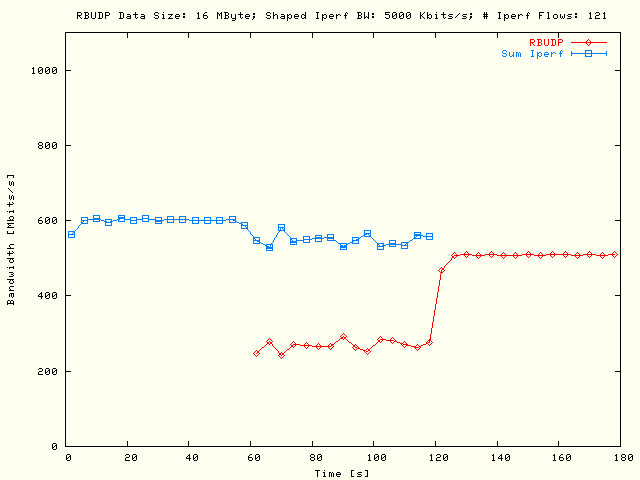
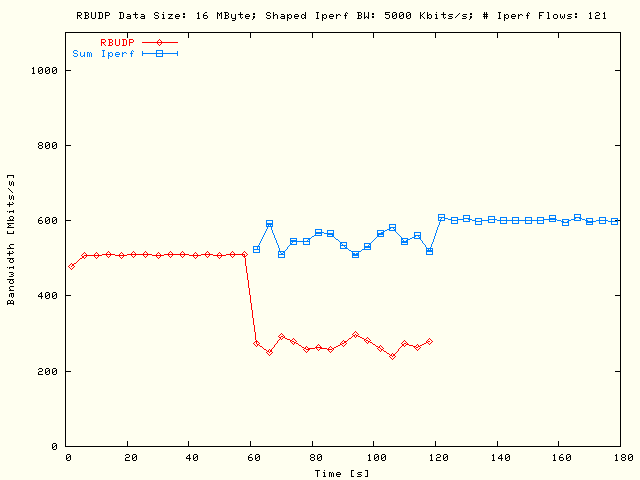
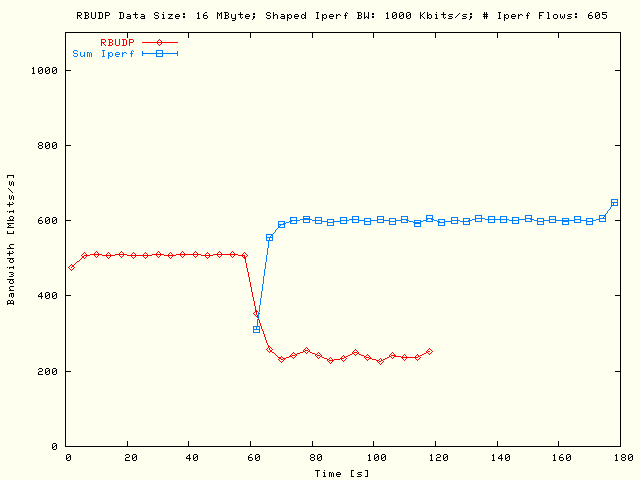
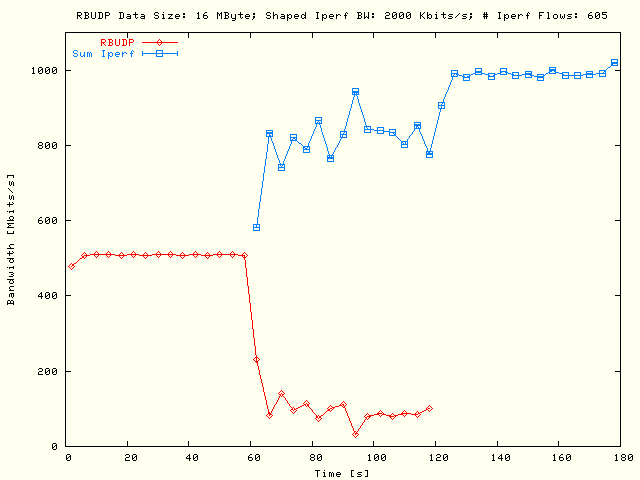
Single flow
RBUDP and multiple flows TCP
bandwidth as a function of the absolute test time. In the left plot the
RBUDP flow has been delayed
and in the right plot the TCP flows. The TCP flows were defined by all
possible 11 × 11 node pairs, using one parallel flow per
node pair with a RBUDP data
size of 16 MBytes and a shaped TCP bandwidth of
5 Mbits/s. |
| . |
|
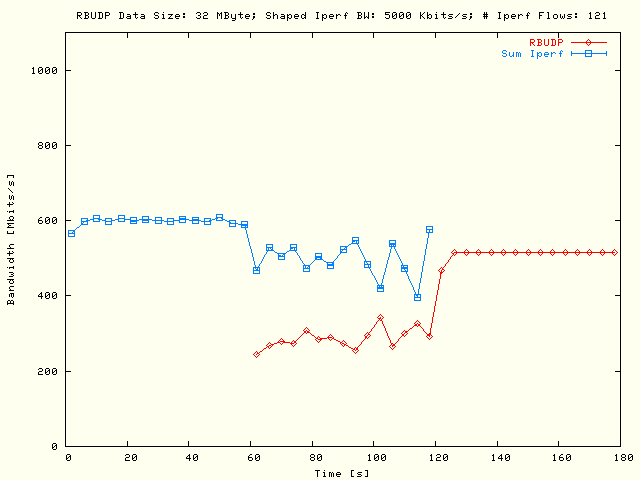
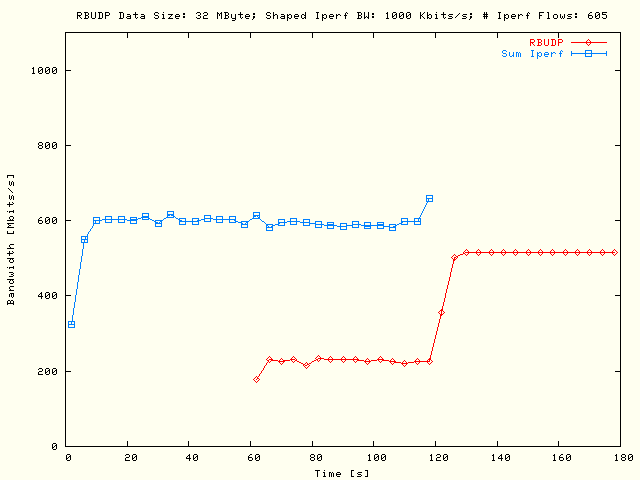
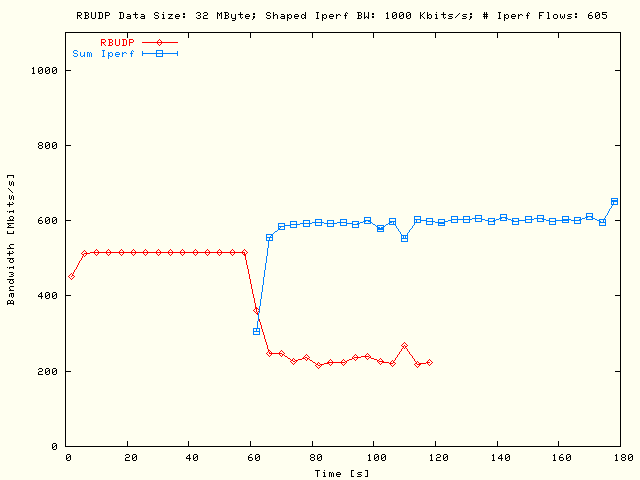
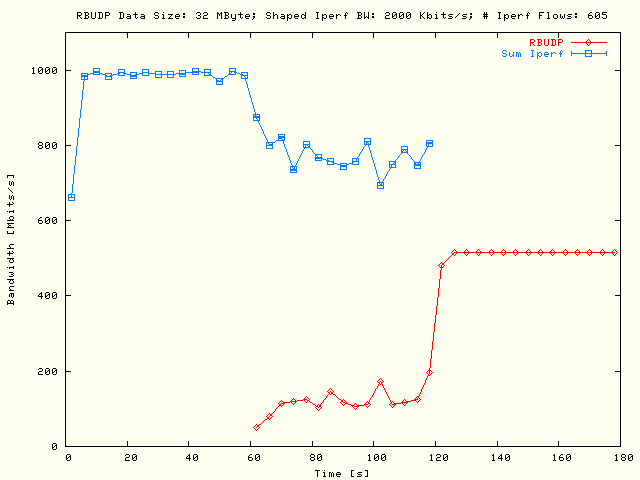
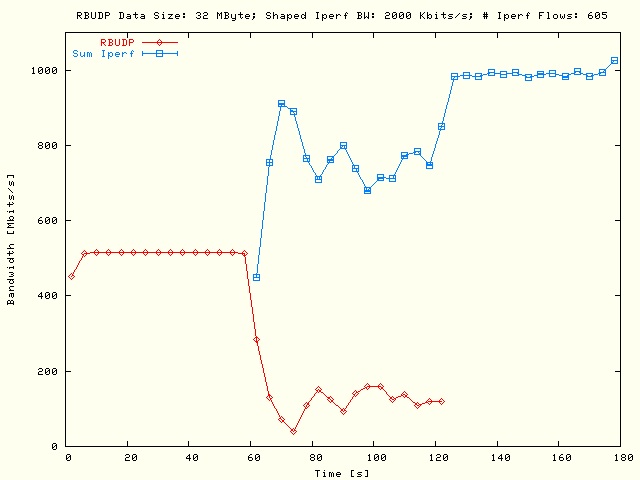
Single flow
RBUDP and multiple flows TCP
bandwidth as a function of the absolute test time. In the left plot the
RBUDP flow has been delayed
and in the right plot the TCP flows. The TCP flows were defined by all
possible 11 × 11 node pairs, using one parallel flow per
node pair with a RBUDP data
size of 32 MBytes and a shaped TCP bandwidth of
5 Mbits/s. |
| . |
|
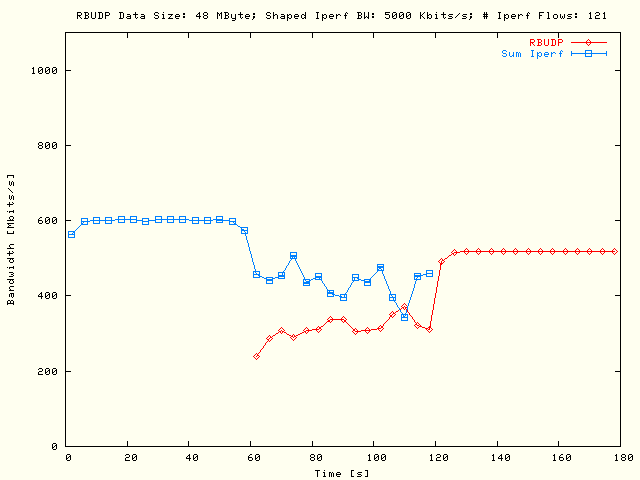
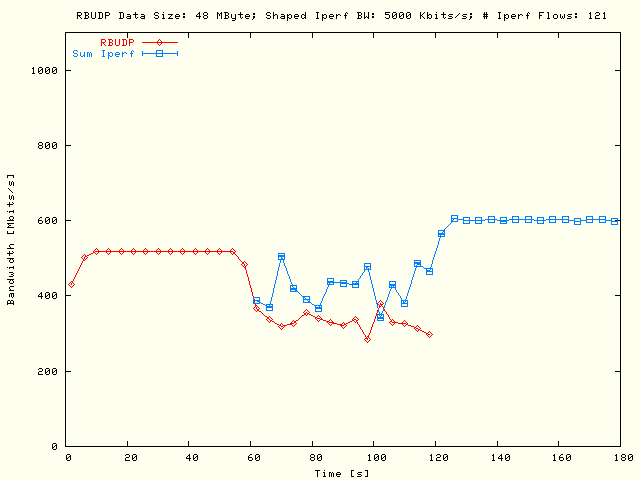
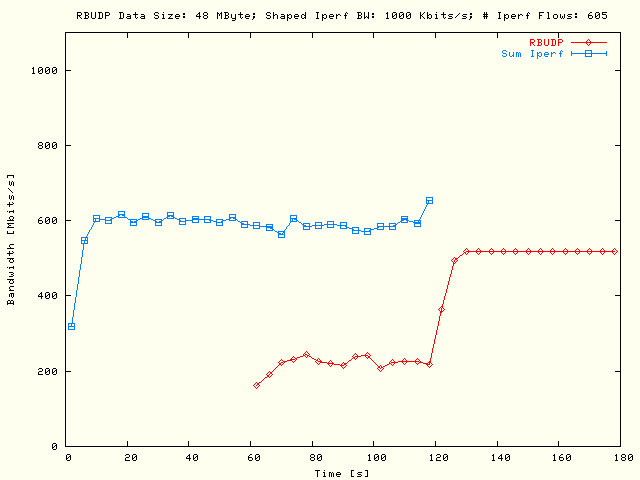
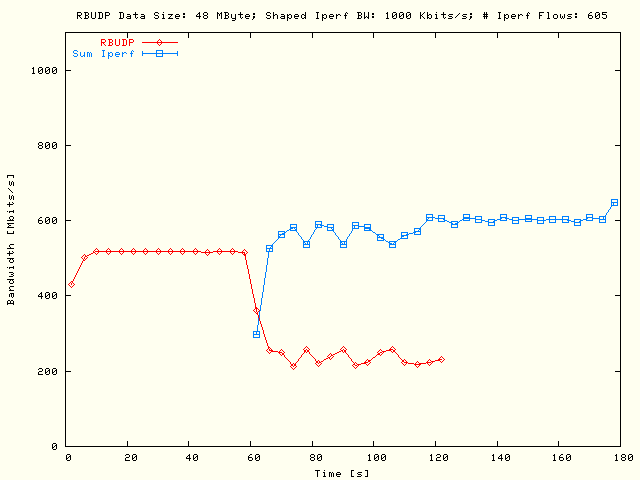
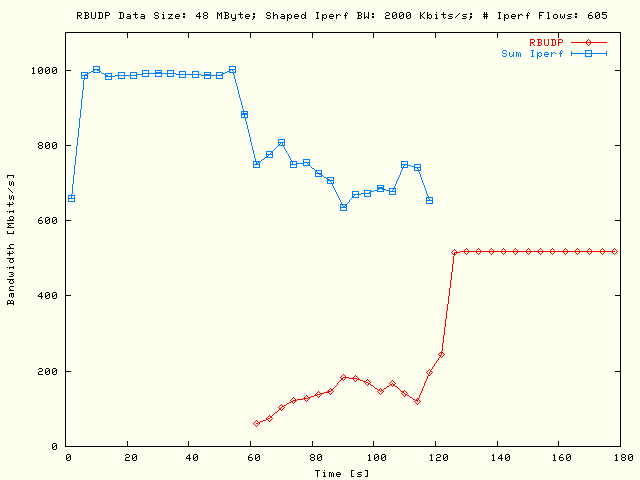
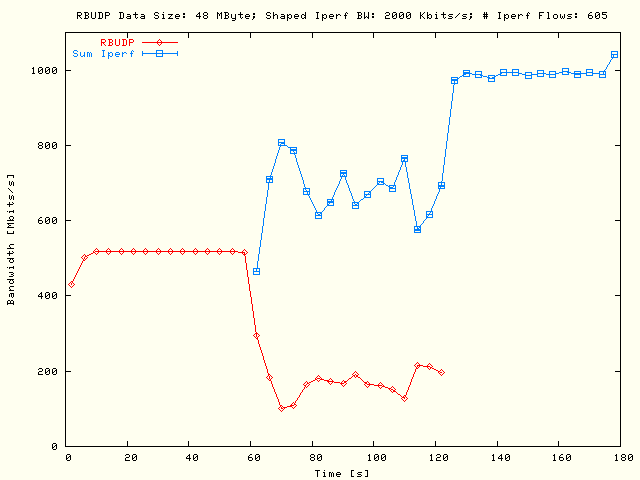
Single flow
RBUDP and multiple flows TCP
bandwidth as a function of the absolute test time. In the left plot the
RBUDP flow has been delayed
and in the right plot the TCP flows. The TCP flows were defined by all
possible 11 × 11 node pairs, using one parallel flow per
node pair with a RBUDP data
size of 48 MBytes and a shaped TCP bandwidth of
5 Mbits/s. |
| . |
|
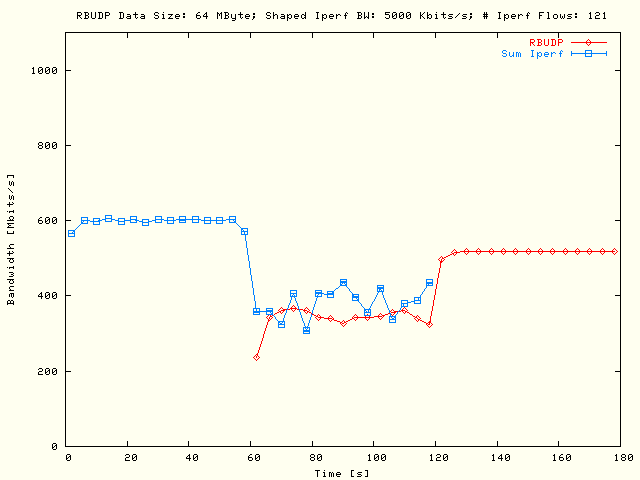
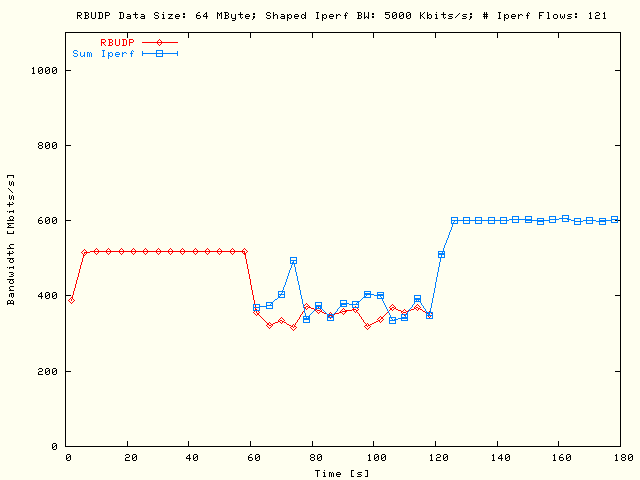
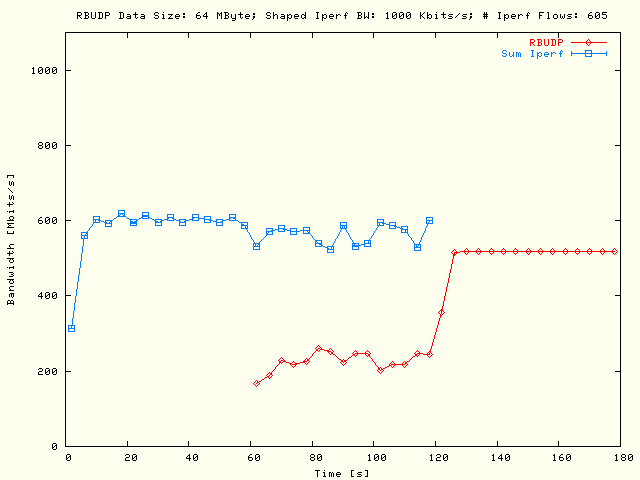
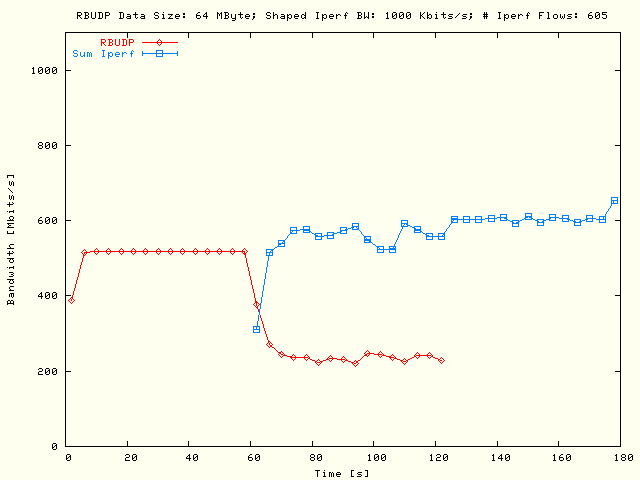
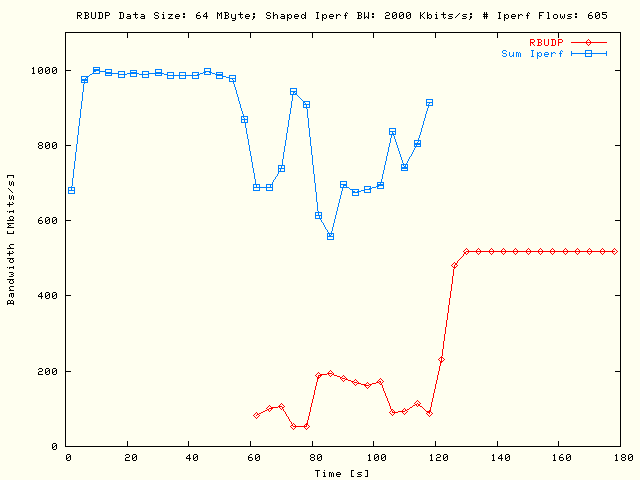
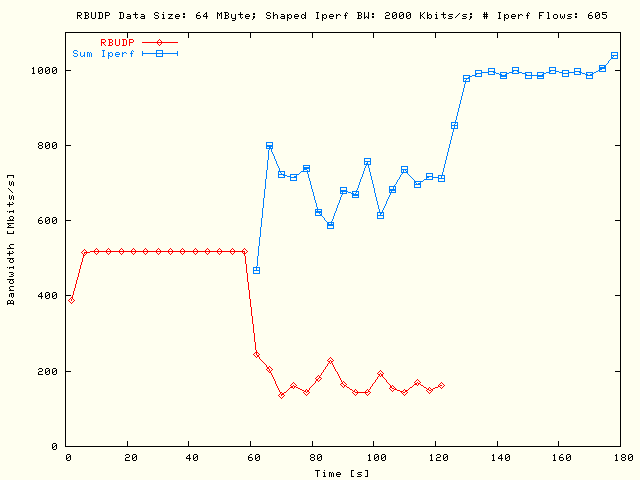
Single flow
RBUDP and multiple flows TCP
bandwidth as a function of the absolute test time. In the left plot the
RBUDP flow has been delayed
and in the right plot the TCP flows. The TCP flows were defined by all
possible 11 × 11 node pairs, using one parallel flow per
node pair with a RBUDP data
size of 64 MBytes and a shaped TCP bandwidth of
5 Mbits/s. |
| . |
|
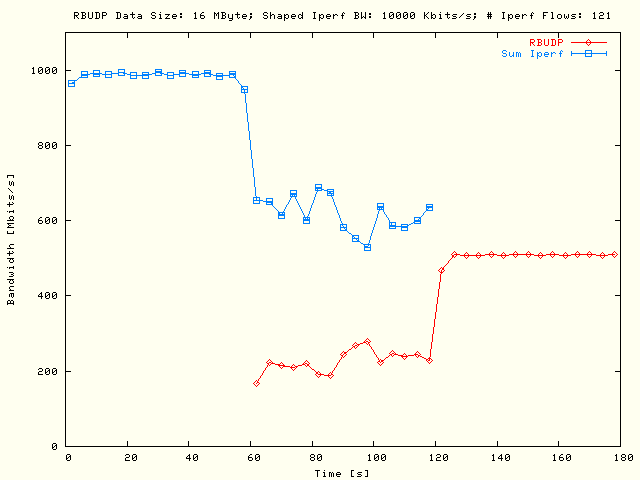
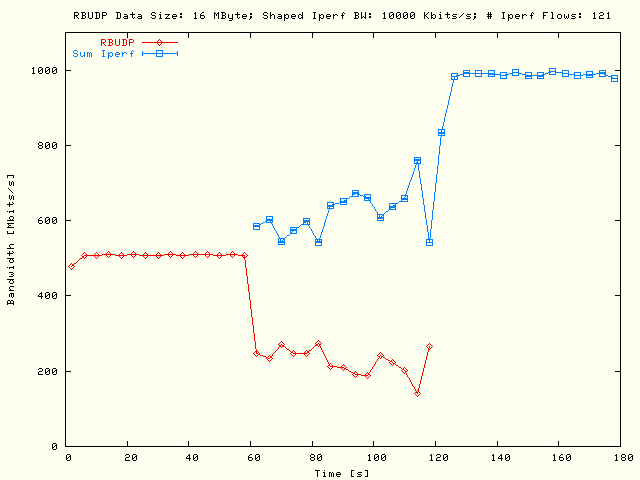
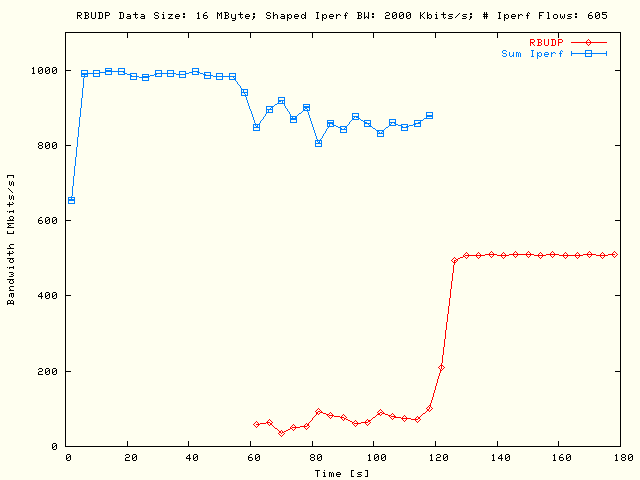
Single flow
RBUDP and multiple flows TCP
bandwidth as a function of the absolute test time. In the left plot the
RBUDP flow has been delayed
and in the right plot the TCP flows. The TCP flows were defined by all
possible 11 × 11 node pairs, using one parallel flow per
node pair with a RBUDP data
size of 16 MBytes and a shaped TCP bandwidth of
10 Mbits/s. |
| . |
|
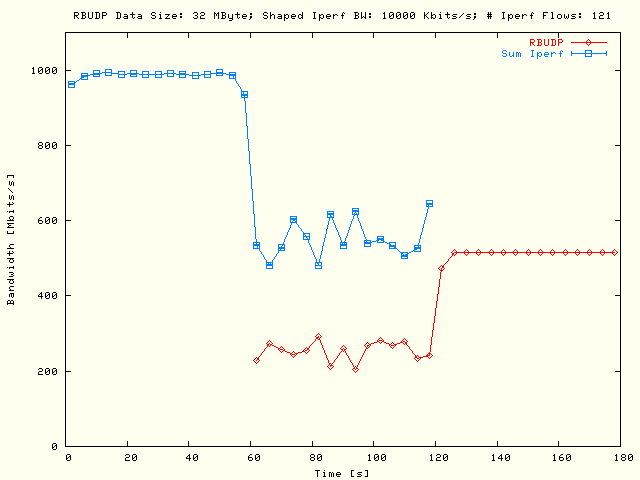
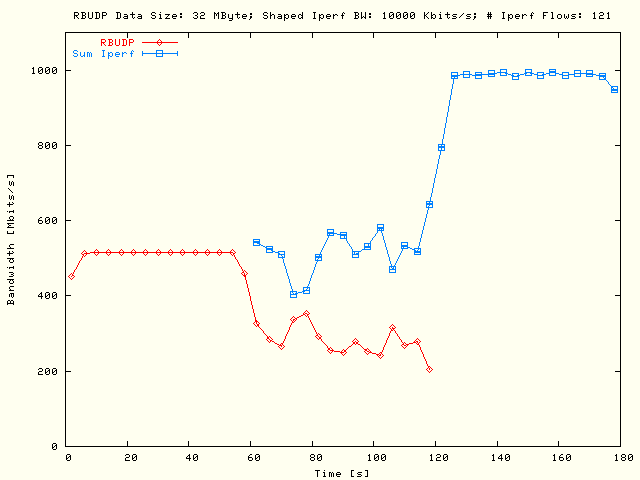
Single flow
RBUDP and multiple flows TCP
bandwidth as a function of the absolute test time. In the left plot the
RBUDP flow has been delayed
and in the right plot the TCP flows. The TCP flows were defined by all
possible 11 × 11 node pairs, using one parallel flow per
node pair with a RBUDP data
size of 32 MBytes and a shaped TCP bandwidth of
10 Mbits/s. |
| . |
|
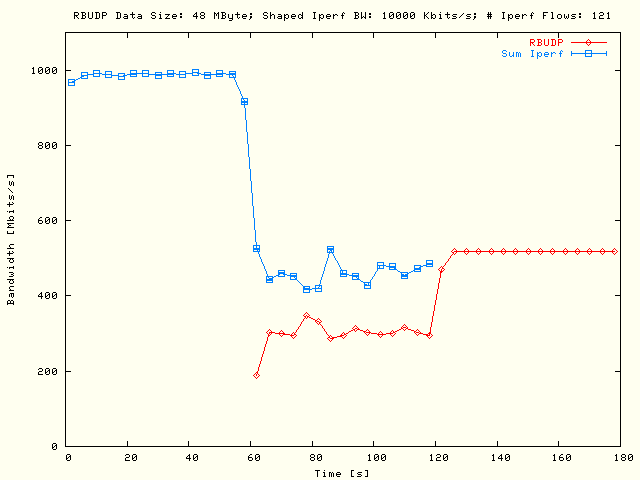
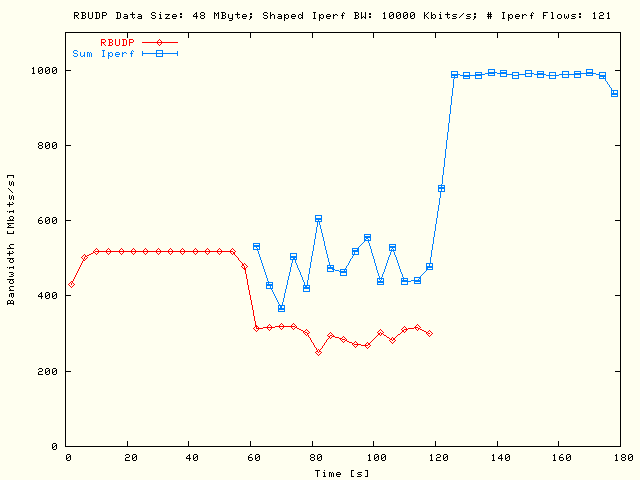
Single flow
RBUDP and multiple flows TCP
bandwidth as a function of the absolute test time. In the left plot the
RBUDP flow has been delayed
and in the right plot the TCP flows. The TCP flows were defined by all
possible 11 × 11 node pairs, using one parallel flow per
node pair with a RBUDP data
size of 48 MBytes and a shaped TCP bandwidth of
10 Mbits/s. |
| . |
|
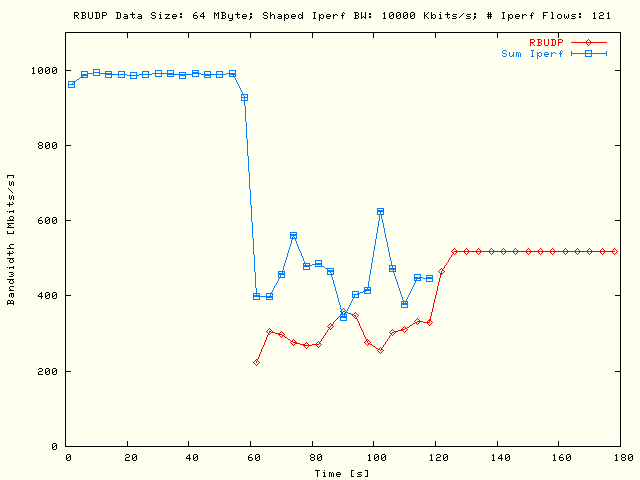
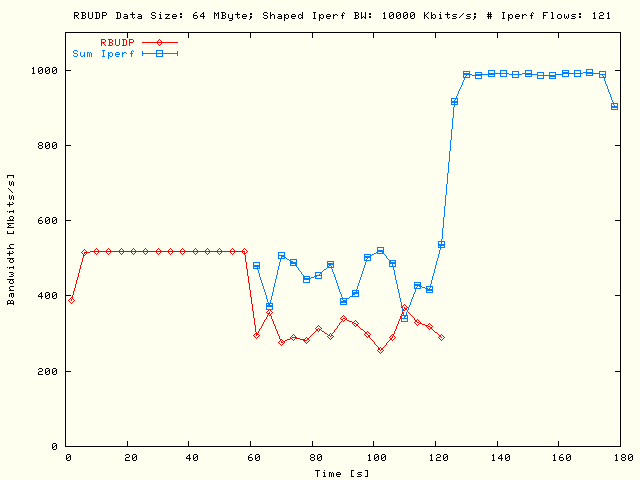
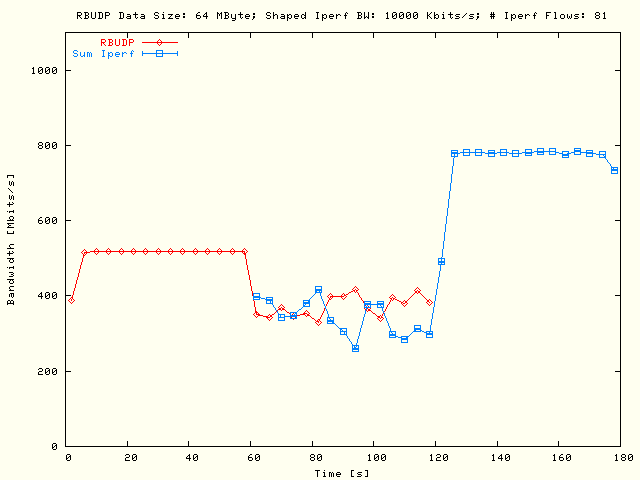
Single flow
RBUDP and multiple flows TCP
bandwidth as a function of the absolute test time. In the left plot the
RBUDP flow has been delayed
and in the right plot the TCP flows. The TCP flows were defined by all
possible 11 × 11 node pairs, using one parallel flow per
node pair with a RBUDP data
size of 64 MBytes and a shaped TCP bandwidth of
10 Mbits/s. |
In the
equivalent results are displayed as in the
with the only exception that there are now five threaded, parallel TCP flows per
node pair used instead of one in the previous situation with the constraint that
the sum over all parallel flows per node pair had been kept the same in both
plot series.
| . |
|
Single flow
RBUDP and multiple flows TCP
bandwidth as a function of the absolute test time. In the left plot the
RBUDP flow has been delayed
and in the right plot the TCP flows. The TCP flows were defined by all
possible 11 × 11 node pairs, using five parallel flows
per node pair. The RBUDP
data size was 16 MBytes and the sum of the shaped TCP bandwidth
over the parallel flows per node pair was
5 Mbits/s. |
| . |
|
Single flow
RBUDP and multiple flows TCP
bandwidth as a function of the absolute test time. In the left plot the
RBUDP flow has been delayed
and in the right plot the TCP flows. The TCP flows were defined by all
possible 11 × 11 node pairs, using five parallel flows
per node pair. The RBUDP
data size was 32 MBytes and the sum of the shaped TCP bandwidth
over the parallel flows per node pair was
5 Mbits/s. |
| . |
|
Single flow
RBUDP and multiple flows TCP
bandwidth as a function of the absolute test time. In the left plot the
RBUDP flow has been delayed
and in the right plot the TCP flows. The TCP flows were defined by all
possible 11 × 11 node pairs, using five parallel flows
per node pair. The RBUDP
data size was 48 MBytes and the sum of the shaped TCP bandwidth
over the parallel flows per node pair was
5 Mbits/s. |
| . |
|
Single flow
RBUDP and multiple flows TCP
bandwidth as a function of the absolute test time. In the left plot the
RBUDP flow has been delayed
and in the right plot the TCP flows. The TCP flows were defined by all
possible 11 × 11 node pairs, using five parallel flows
per node pair. The RBUDP
data size was 64 MBytes and the sum of the shaped TCP bandwidth
over the parallel flows per node pair was
5 Mbits/s. |
| . |
|
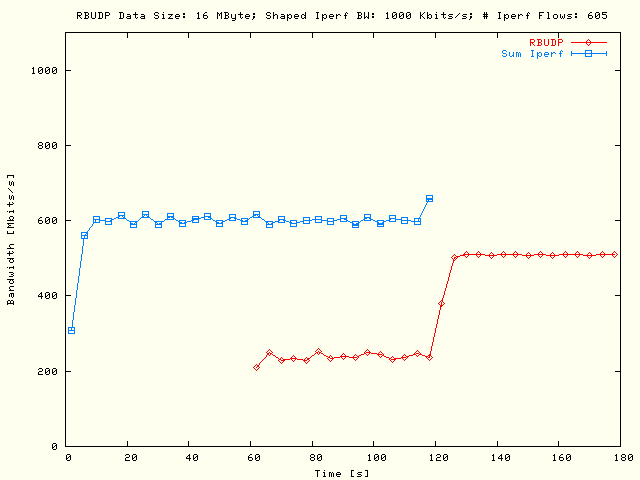
Single flow
RBUDP and multiple flows TCP
bandwidth as a function of the absolute test time. In the left plot the
RBUDP flow has been delayed
and in the right plot the TCP flows. The TCP flows were defined by all
possible 11 × 11 node pairs, using five parallel flows
per node pair. The RBUDP
data size was 16 MBytes and the sum of the shaped TCP bandwidth
over the parallel flows per node pair was
10 Mbits/s. |
| . |
|
Single flow
RBUDP and multiple flows TCP
bandwidth as a function of the absolute test time. In the left plot the
RBUDP flow has been delayed
and in the right plot the TCP flows. The TCP flows were defined by all
possible 11 × 11 node pairs, using five parallel flows
per node pair. The RBUDP
data size was 32 MBytes and the sum of the shaped TCP bandwidth
over the parallel flows per node pair was
10 Mbits/s. |
| . |
|
Single flow
RBUDP and multiple flows TCP
bandwidth as a function of the absolute test time. In the left plot the
RBUDP flow has been delayed
and in the right plot the TCP flows. The TCP flows were defined by all
possible 11 × 11 node pairs, using five parallel flows
per node pair. The RBUDP
data size was 48 MBytes and the sum of the shaped TCP bandwidth
over the parallel flows per node pair was
10 Mbits/s. |
| . |
|
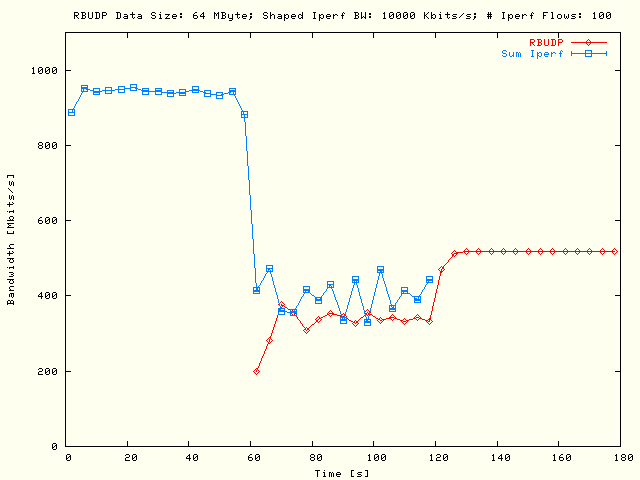
Single flow
RBUDP and multiple flows TCP
bandwidth as a function of the absolute test time. In the left plot the
RBUDP flow has been delayed
and in the right plot the TCP flows. The TCP flows were defined by all
possible 11 × 11 node pairs, using five parallel flows
per node pair. The RBUDP
data size was 64 MBytes and the sum of the shaped TCP bandwidth
over the parallel flows per node pair was
10 Mbits/s. |
When the results with a single TCP flow per node pair
()
are compared with the results where five threaded, parallel TCP flows per node
pair has been used
()
there follows that with five parallel TCP flows per node pair the impact upon
the RBUDP traffic is larger as with
a single flow per node pair. Of course the influence with a shaping TCP
bandwidth of 10 Mbits/s, summed over the threaded parallel flows, upon the
RBUDP flow is larger as with a
summed shaping bandwidth of 5 Mbits/s. On the other hand the impact of the
RBUDP traffic is maximal with the
largest value of the RBUDP data
size.
As in the
"Bandwidth Interval
Plots" section for the UDT
traffic type, the unrealistic high TCP bandwidth values from the highest
interval report is an artifact from the
Iperf tool. Again the
Iperf and
RBUDP boundaries of the bandwidth
reports do not exactly match with the used interval time. To be able to sum the
TCP bandwidths, the intervals are re-sampled back to the time stamps following
from the used interval time. To be consistent the same re-sampling has also been
used for the single flow RBUDP
results.
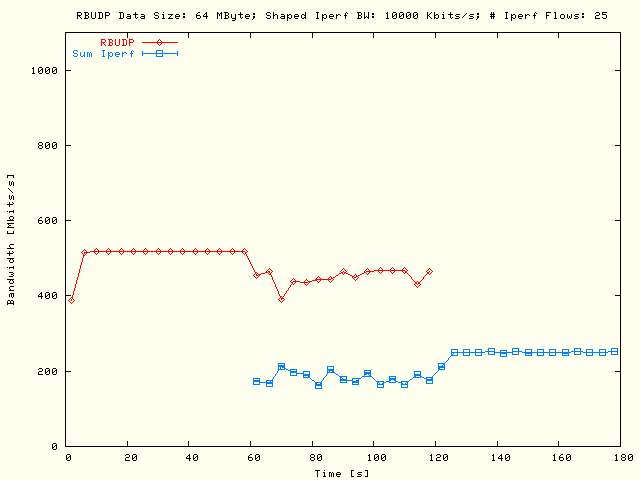
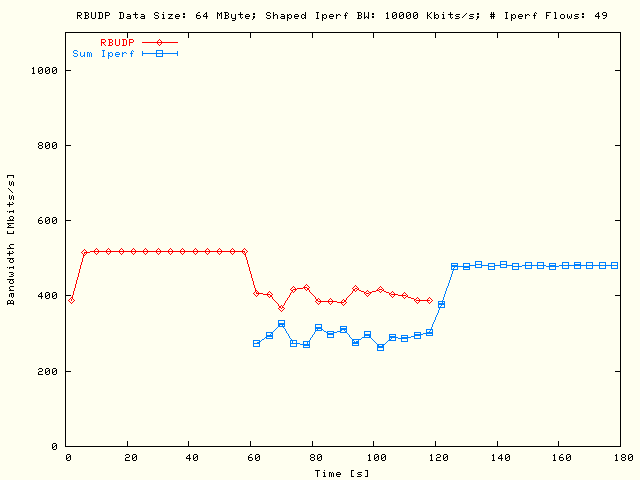
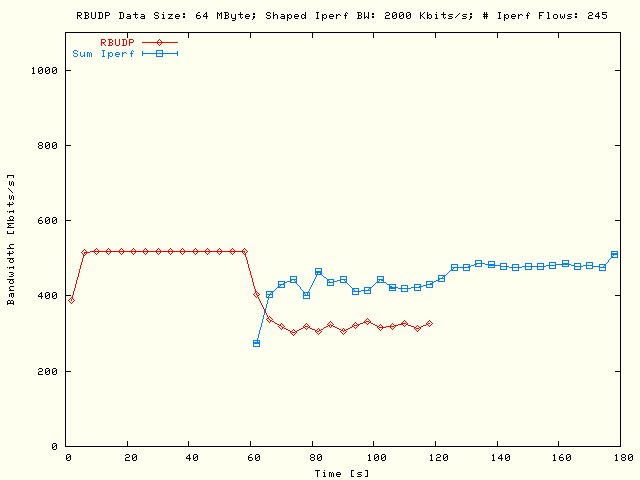
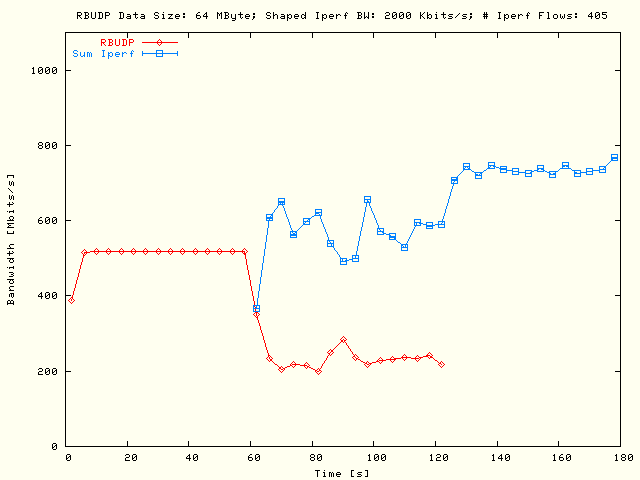
# TCP Flows Variation
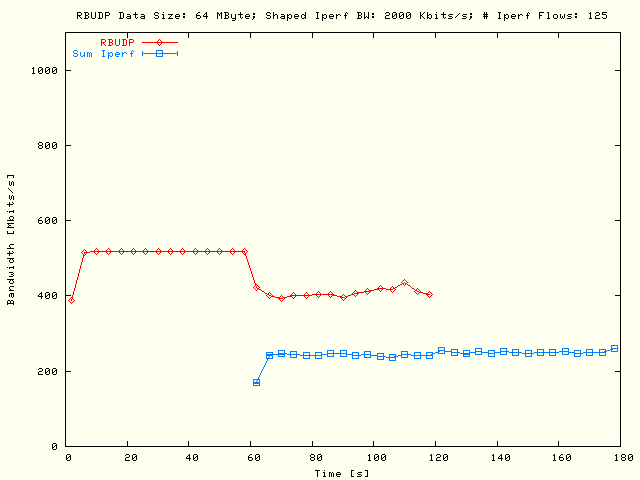
As before the
are presenting bandwidth interval report plots as a function of the absolute
interval time, but in these plots the # TCP flows, defined by the
# source - destination node pairs, will be varied. These results are
displayed for a RBUDP data size of
64 MBytes, for single parallel TCP flows and with a shaped TCP bandwidth
of 10 Mbits/s.
| . |
|
Single flow
RBUDP and multiple flows TCP
bandwidth as a function of the absolute test time. In the left plot the
RBUDP flow has been delayed and
in the right plot the TCP flows. The TCP flows were defined by all possible
5 × 5 node pairs, using one parallel flow per node pair with
a RBUDP data size of
64 MBytes and a shaped bandwidth of 10 Mbits/s. |
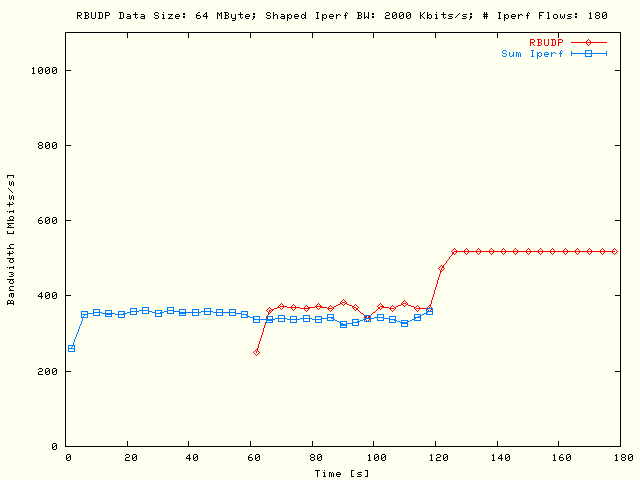
| . |
|
Single flow
RBUDP and multiple flows TCP
bandwidth as a function of the absolute test time. In the left plot the
RBUDP flow has been delayed and
in the right plot the TCP flows. The TCP flows were defined by all possible
6 × 6 node pairs, using one parallel flow per node pair with
a RBUDP data size of
64 MBytes and a shaped bandwidth of 10 Mbits/s. |
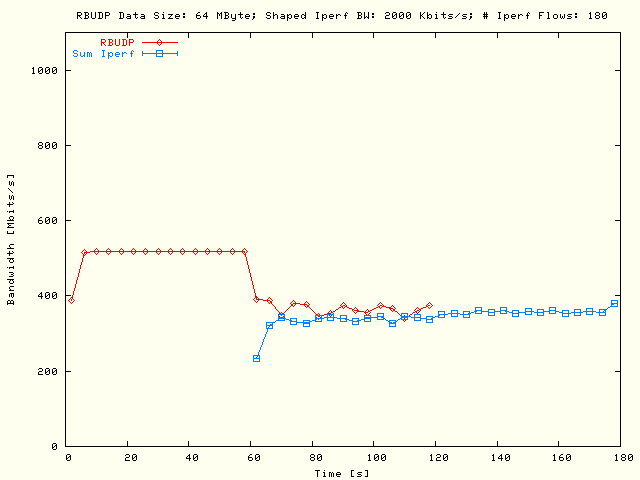
| . |
|
Single flow
RBUDP and multiple flows TCP
bandwidth as a function of the absolute test time. In the left plot the
RBUDP flow has been delayed and
in the right plot the TCP flows. The TCP flows were defined by all possible
7 × 7 node pairs, using one parallel flow per node pair with
a RBUDP data size of
64 MBytes and a shaped bandwidth of 10 Mbits/s. |
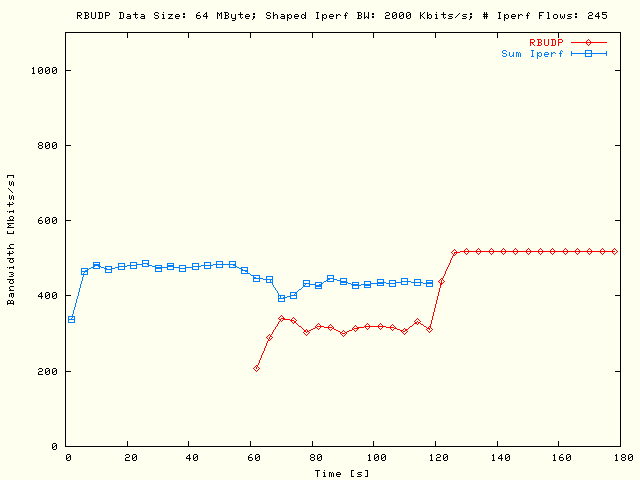
| . |
|
Single flow
RBUDP and multiple flows TCP
bandwidth as a function of the absolute test time. In the left plot the
RBUDP flow has been delayed and
in the right plot the TCP flows. The TCP flows were defined by all possible
8 × 8 node pairs, using one parallel flow per node pair with
a RBUDP data size of
64 MBytes and a shaped bandwidth of 10 Mbits/s. |
| . |
|
Single flow
RBUDP and multiple flows TCP
bandwidth as a function of the absolute test time. In the left plot the
RBUDP flow has been delayed and
in the right plot the TCP flows. The TCP flows were defined by all possible
9 × 9 node pairs, using one parallel flow per node pair with
a RBUDP data size of
64 MBytes and a shaped bandwidth of 10 Mbits/s. |
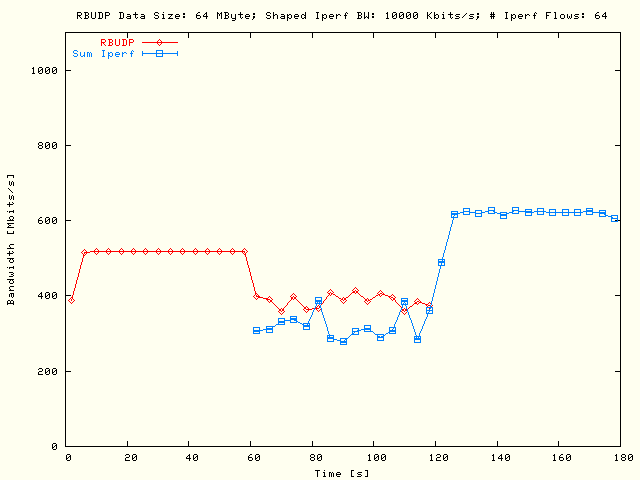
| . |
|
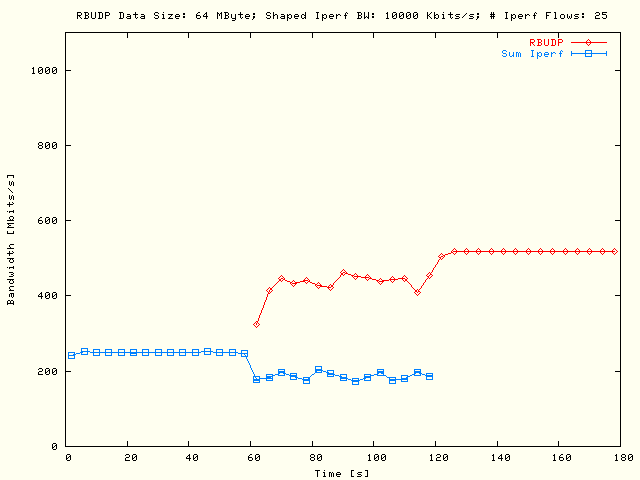
Single flow
RBUDP and multiple flows TCP
bandwidth as a function of the absolute test time. In the left plot the
RBUDP flow has been delayed and
in the right plot the TCP flows. The TCP flows were defined by all possible
10 × 10 node pairs, using one parallel flow per node pair
with a RBUDP data size of
64 MBytes and a shaped bandwidth of 10 Mbits/s. |
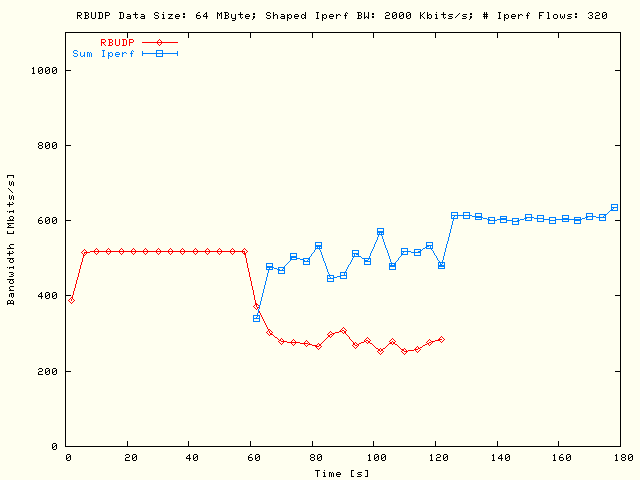
| . |
|
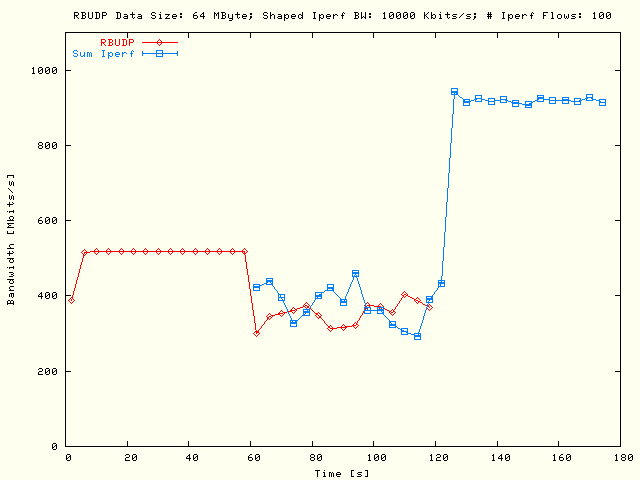
Single flow
RBUDP and multiple flows TCP
bandwidth as a function of the absolute test time. In the left plot the
RBUDP flow has been delayed and
in the right plot the TCP flows. The TCP flows were defined by all possible
11 × 11 node pairs, using one parallel flow per node pair
with a RBUDP data size of
64 MBytes and a shaped bandwidth of 10 Mbits/s. |
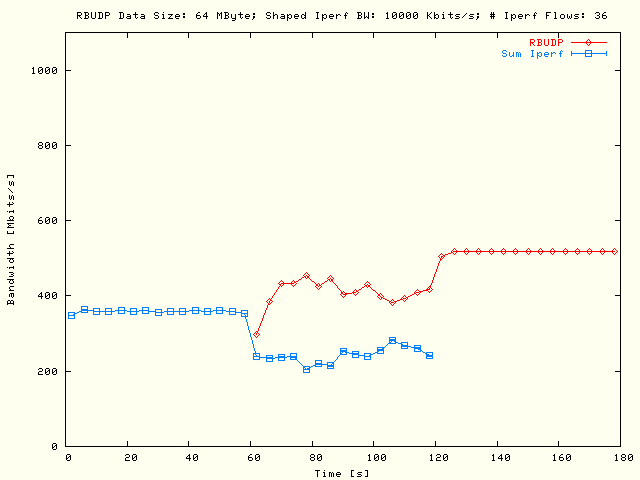
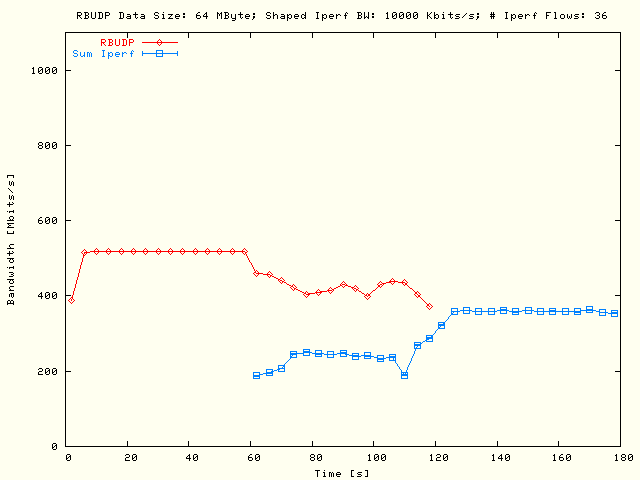
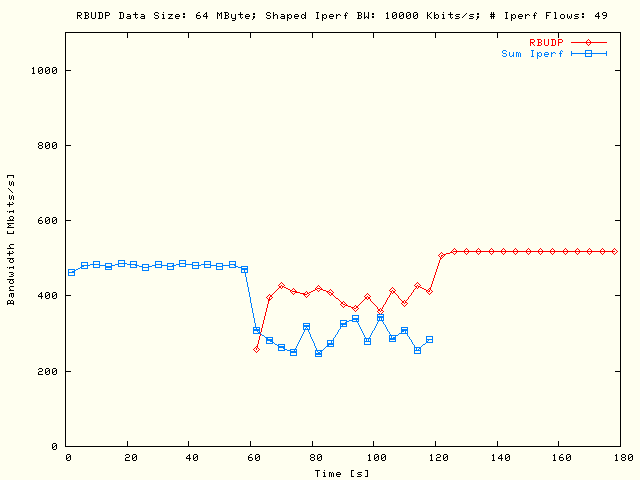
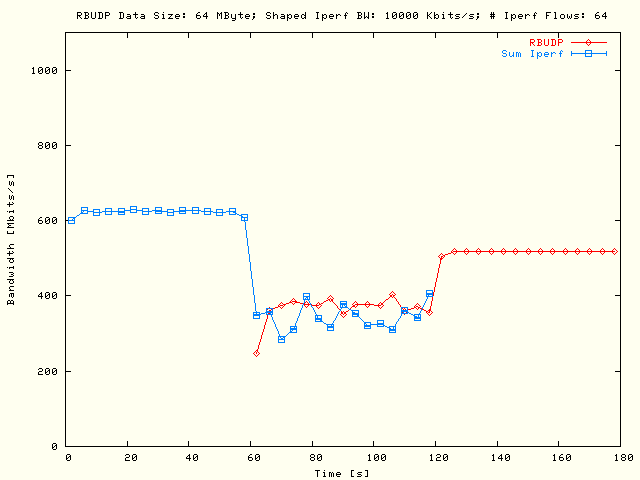
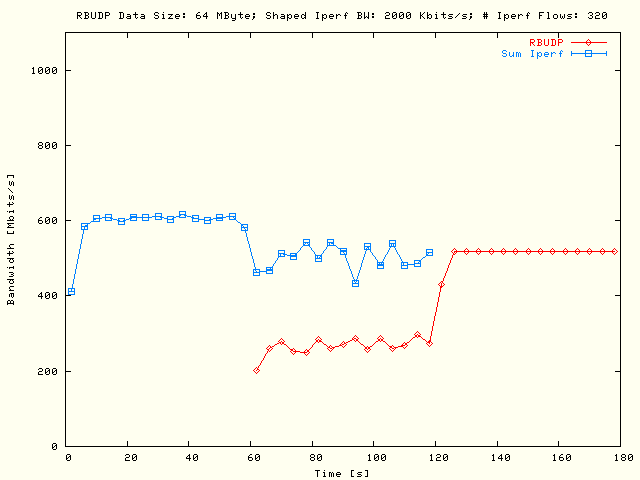
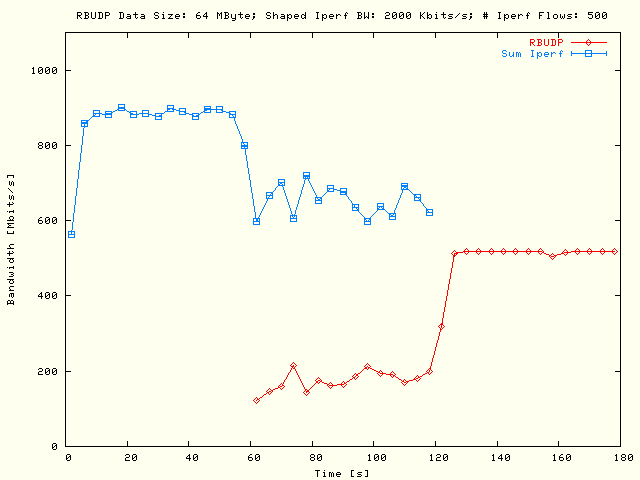
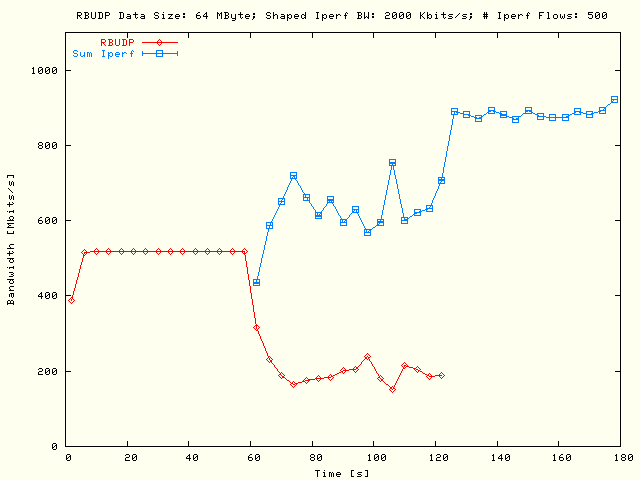
Equivalent results as in
,
but now with five parallel flows per node pair has been presented in the
.
The sum of the shaped TCP bandwidth, taken over the five parallel flows per
node, is again 10 Mbits/s such that it is equal to the situation with a
single flow per node pair.
| . |
|
Single flow
RBUDP and multiple flows TCP
bandwidth as a function of the absolute test time. In the left plot the
RBUDP flow has been delayed and
in the right plot the TCP flows. The TCP flows were defined by all possible
5 × 5 node pairs, using five parallel flows per node pair
with a RBUDP data size of
64 MBytes. The sum of the shaped TCP bandwidth over the parallel flows
per node pair was 10 Mbits/s. |
| . |
|
Single flow
RBUDP and multiple flows TCP
bandwidth as a function of the absolute test time. In the left plot the
RBUDP flow has been delayed and
in the right plot the TCP flows. The TCP flows were defined by all possible
6 × 6 node pairs, using five parallel flows per node pair
with a RBUDP data size of
64 MBytes. The sum of the shaped TCP bandwidth over the parallel flows
per node pair was 10 Mbits/s. |
| . |
|
Single flow
RBUDP and multiple flows TCP
bandwidth as a function of the absolute test time. In the left plot the
RBUDP flow has been delayed and
in the right plot the TCP flows. The TCP flows were defined by all possible
7 × 7 node pairs, using five parallel flows per node pair
with a RBUDP data size of
64 MBytes. The sum of the shaped TCP bandwidth over the parallel flows
per node pair was 10 Mbits/s. |
| . |
|
Single flow
RBUDP and multiple flows TCP
bandwidth as a function of the absolute test time. In the left plot the
RBUDP flow has been delayed and
in the right plot the TCP flows. The TCP flows were defined by all possible
8 × 8 node pairs, using five parallel flows per node pair
with a RBUDP data size of
64 MBytes. The sum of the shaped TCP bandwidth over the parallel flows
per node pair was 10 Mbits/s. |
| . |
|
Single flow
RBUDP and multiple flows TCP
bandwidth as a function of the absolute test time. In the left plot the
RBUDP flow has been delayed and
in the right plot the TCP flows. The TCP flows were defined by all possible
9 × 9 node pairs, using five parallel flows per node pair
with a RBUDP data size of
64 MBytes. The sum of the shaped TCP bandwidth over the parallel flows
per node pair was 10 Mbits/s. |
| . |
|
Single flow
RBUDP and multiple flows TCP
bandwidth as a function of the absolute test time. In the left plot the
RBUDP flow has been delayed and
in the right plot the TCP flows. The TCP flows were defined by all possible
10 × 10 node pairs, using five parallel flows per node pair
with a RBUDP data size of
64 MBytes. The sum of the shaped TCP bandwidth over the parallel flows
per node pair was 10 Mbits/s. |
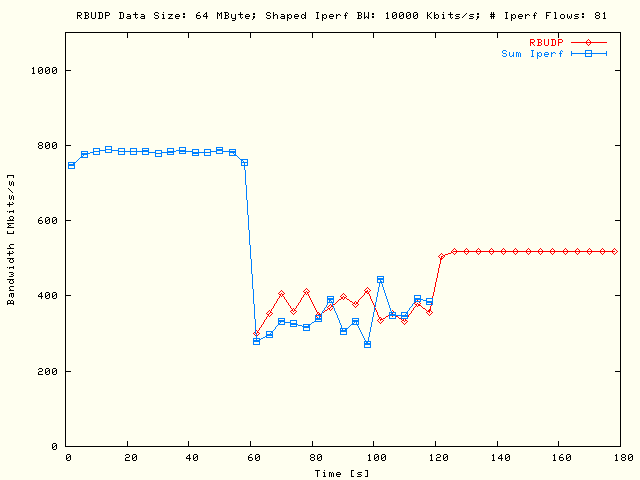
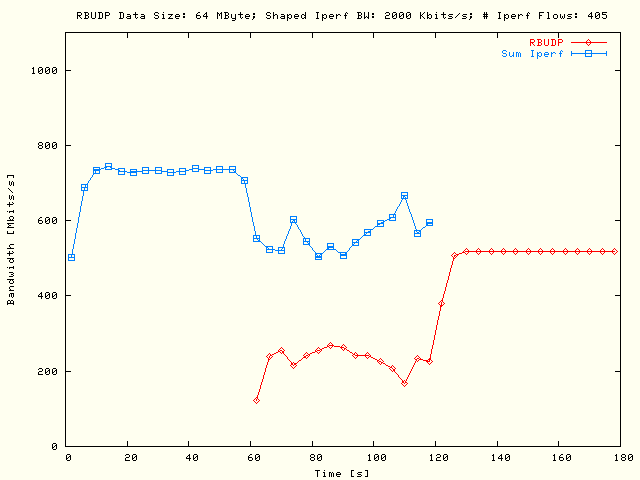
| . |
|
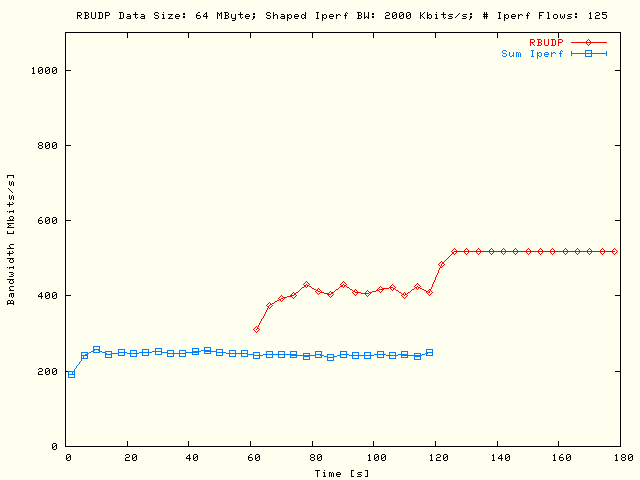
Single flow
RBUDP and multiple flows TCP
bandwidth as a function of the absolute test time. In the left plot the
RBUDP flow has been delayed and
in the right plot the TCP flows. The TCP flows were defined by all possible
11 × 11 node pairs, using five parallel flows per node pair
with a RBUDP data size of
64 MBytes. The sum of the shaped TCP bandwidth over the parallel flows
per node pair was 10 Mbits/s. |
Conclusions
From the results in
the following conclusions can be drawn:
-
There are no significant differences between the tests where the
RBUDP flow is started first and
the reverse situation where the
Iperf are started first.
The (almost) zero round-trip times are probably the reason for that.
-
There is almost no variation in the
Iperf bandwidth values.
Presumably that will also be related with the zero round-trip time values.
-
A remarkable difference between the tests with one parallel flow per node
pair
()
and those with five parallel flows per node pair
()
is that in the areas with combined
RBUDP and TCP traffic types, the
impact from the TCP traffic upon the
RBUDP is much larger for the
situation with five parallel flows per node pair, while the total
throughput, summed over all flows, in the area with TCP traffic only is
about the same for one flow or five parallel flows per node pair when the
# involved node pairs are equal in both situations.