UDP Bulk Tests
Description
Below the results of executed UDP bulk tests will be displayed. Also in these
tests the Iperf
V. 1.6.5 traffic generator will be used. The UDP bulk tests have been
executed as a function of the shaping bandwidth and of the # parallel
flows. The UDP tests have been executed in both directions, also in the
directions with and without rate limiting.
Results
In the following plots the sum UDP client and server bandwidth values, taken
over the # parallel flows, has been displayed as a function of the sum
shaping bandwidth, also taken over the # parallel flows, and as a function
of those # parallel flows. The duration of each flow was 60 s. the sum
client and server bandwidth values were taken over the final bandwidth values of
the single flows. In
the client bandwidth is presented for the direction with rate limiting
Amsterdam Science Park -> StarLight, while the server
bandwidth for that direction is shown in
.
In
the client bandwidth is displayed for the reverse direction
StarLight -> Amsterdam Science Park and in
the server bandwidth for that direction.
| . |
|
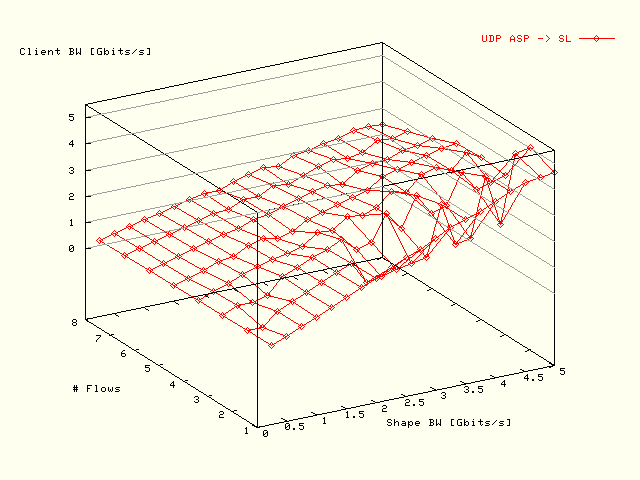
Sum UDP client bulk bandwidth, taken over the
# parallel flows, as a function of the sum shaping bandwidth, also
taken over the # parallel flows, and of the # parallel flows for
the direction with rate limiting Amsterdam Science Park ->
StarLight. |
| . |
|
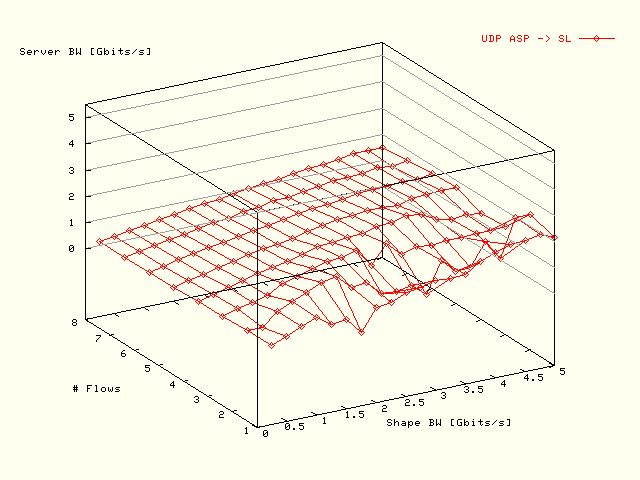
Sum UDP server bulk bandwidth, taken over the
# parallel flows, as a function of the sum shaping bandwidth, also
taken over the # parallel flows, and of the # parallel flows for
the direction with rate limiting Amsterdam Science Park ->
StarLight. |
| . |
|
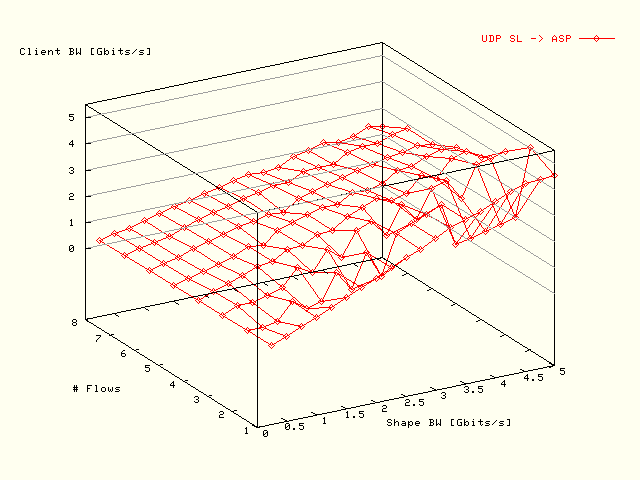
Sum UDP client bulk bandwidth, taken over the
# parallel flows, as a function of the sum shaping bandwidth, also
taken over the # parallel flows, and of the # parallel flows for
the direction without rate limiting StarLight ->
Amsterdam Science Park. |

| . |
|
Sum UDP server bulk bandwidth, taken over the
# parallel flows, as a function of the sum shaping bandwidth, also
taken over the # parallel flows, and of the # parallel flows for
the direction without rate limiting StarLight ->
Amsterdam Science Park. |
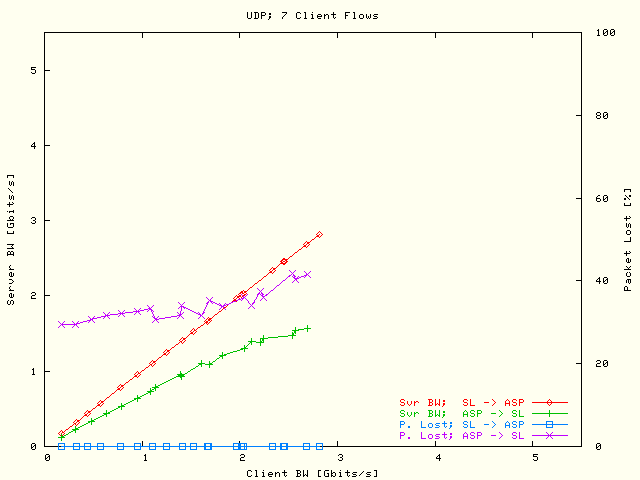
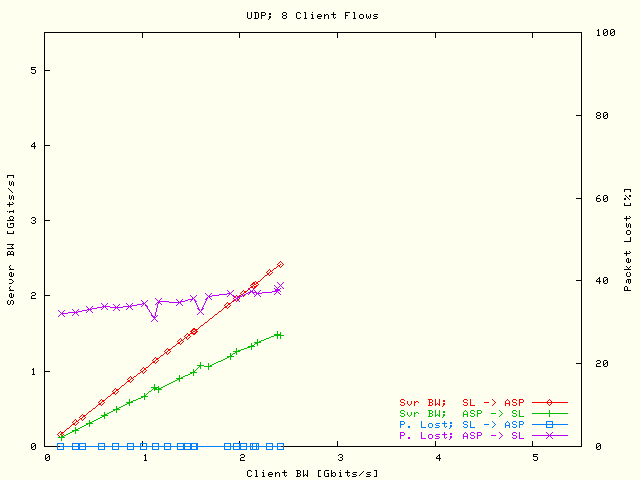
Below a different view at the data has been offered enlarged with information
about the # packet lost. In the following figures the UDP sum server
bandwidth, taken over the # parallel flows, and the total # packet
lost for all parallel flows have been displayed as a function of the sum client
bandwidth (also taken over the # parallel flows) for both directions
StarLight <-> Amsterdam Science Park. In the
these results have been displayed for 1, 2, ..., 8 parallel flows.
| . |
|
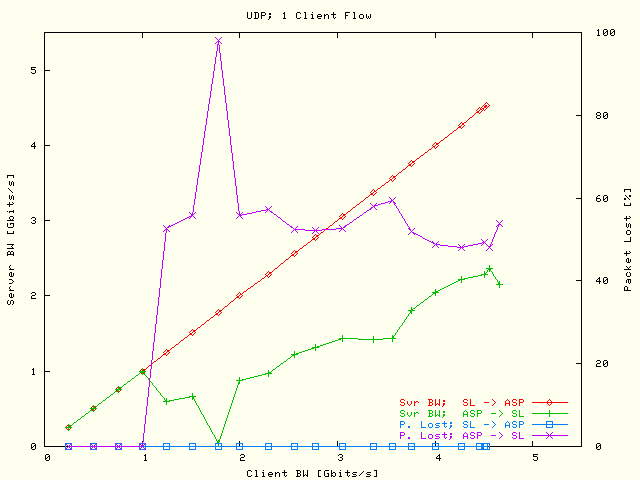
Sum UDP server bandwidth, taken over the
# parallel flows, and the total # packet lost for all parallel
flows have been displayed as a function of the sum client bandwidth (also
taken over the # parallel flows) using one parallel
flow. |
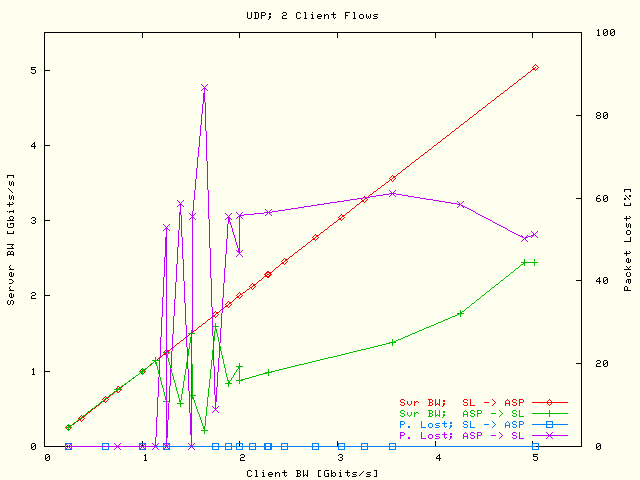
| . |
|
Sum UDP server bandwidth, taken over the
# parallel flows, and the total # packet lost for all parallel
flows have been displayed as a function of the sum client bandwidth (also
taken over the # parallel flows) using two parallel
flows. |
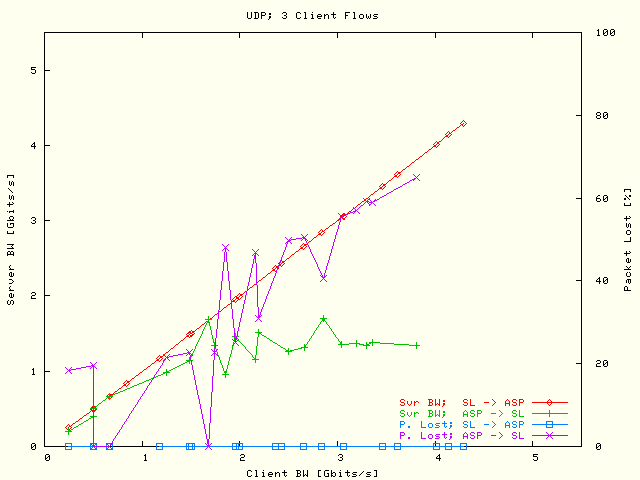
| . |
|
Sum UDP server bandwidth, taken over the
# parallel flows, and the total # packet lost for all parallel
flows have been displayed as a function of the sum client bandwidth (also
taken over the # parallel flows) using three parallel
flows. |
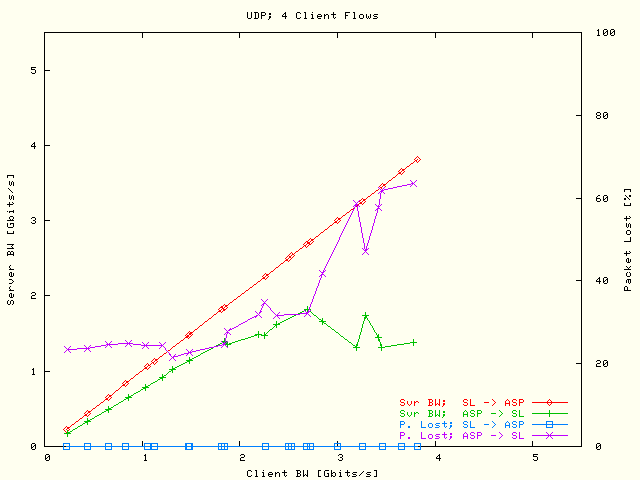
| . |
|
Sum UDP server bandwidth, taken over the
# parallel flows, and the total # packet lost for all parallel
flows have been displayed as a function of the sum client bandwidth (also
taken over the # parallel flows) using four parallel
flows. |
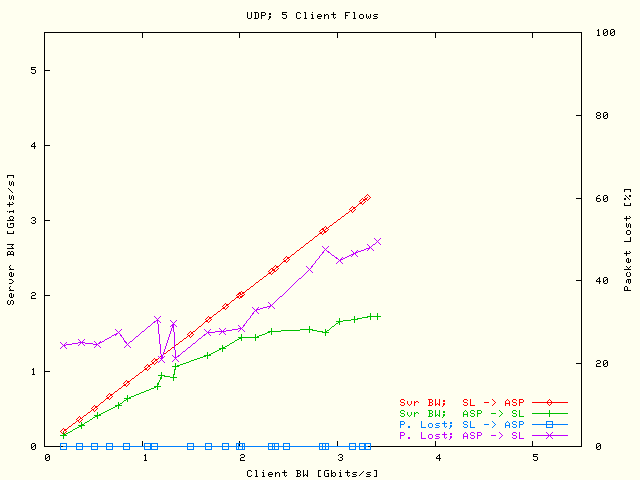
| . |
|
Sum UDP server bandwidth, taken over the
# parallel flows, and the total # packet lost for all parallel
flows have been displayed as a function of the sum client bandwidth (also
taken over the # parallel flows) using five parallel
flows. |

| . |
|
Sum UDP server bandwidth, taken over the
# parallel flows, and the total # packet lost for all parallel
flows have been displayed as a function of the sum client bandwidth (also
taken over the # parallel flows) using six parallel
flows. |
| . |
|
Sum UDP server bandwidth, taken over the
# parallel flows, and the total # packet lost for all parallel
flows have been displayed as a function of the sum client bandwidth (also
taken over the # parallel flows) using seven parallel
flows. |
| . |
|
Sum UDP server bandwidth, taken over the
# parallel flows, and the total # packet lost for all parallel
flows have been displayed as a function of the sum client bandwidth (also
taken over the # parallel flows) using eight parallel
flows. |
Show also the plots from the
as
in a new browser window.
Conclusions
From the UDP bulk tests presented in the
the following conclusions can be drawn:
-
Only for 1 and 2 parallel flows the maximum UDP server bandwidth in the
rate limit direction ASP -> SL (see a.o.
),
but that is still considerably below the rate limit bandwidth of
2800 Mbits/s.
-
When three or more parallel flows are used the client bandwidth is rapidly
decreasing
().
Probably this is due to host limitation effects. Therefore, the obtained
server bandwidths are difficult to compare as a function of the
# parallel flows. But as a function of the client bandwidth the server
bandwidth in the rate limit directions is slightly decreasing, and
corresponding the percentage packet lost is slightly increasing (see also
the
).
The reason probably is that with more parallel flows the chance for packet
lost is increasing caused by an increasing collision chance.
-
In the results with one and two parallel flows
(
)
there are many fluctuations in the results for the server bandwidth and the
corresponding percentage packet lost in the rate limit direction, especially
for client bandwidth values between 1 and 2 Mbits/s. The
relatively small burst size of 50 KBytes, that has been configured at
the Force 10 switch, could play a role here.
-
In the test direction without rate limiting, SL ->
ASP there is never packet lost and the destination, server
bandwidth is always equal to the sender, client bandwidth. Also the obtained
bandwidth values are completely determined by sender limitations.