UDP Profile Tests
Description
Below the results of the UDP profile tests will be presented. As with the
TCP profile tests also here the UDP
bandwidth will be shaped using the triangle profile form that has been shown in
figure 1 from the
"Rate Limit" main section. The shaped UDP
profile has been generated with a modified version of the
Iperf V. 1.6.5 traffic
generator. Again the pthread library could be used to generate multiple
parallel flows.
Results
Profile Bandwidth Interval
Results
The results of the UDP profile tests will be presented in this and the following
subsections. In the following figures the UDP bandwidth values, that were
induced by the provided shaping bandwidth profile, are presented as a function
of the time from the start of the profile. In these figures both the client and
server bandwidth values will be represented by separate plot traces. The results
for various values of the top triangle bandwidth (see
figure 1 from the
"Rate Limit" section) and for various
values of the # parallel UDP flows are presented by individual plots. Again
the displayed UDP bandwidth is the sum value taken over the parallel flows. To
be able to do this the Iperf
bandwidth report values will be re-sampled to the original profile and
Iperf sample interval time
of 4 s.
Below the results for the test direction without rate limit,
StarLight -> Amsterdam Science Park, will be presented
first. As with the results of the
UDP bulk tests, no packet lost could be
observed. Therefore, only the results with the maximum top profile bandwidth of
5 Gbits/s will be presented for 1, 2, 3, 4 and 8 parallel flows in the
.
| . |
|
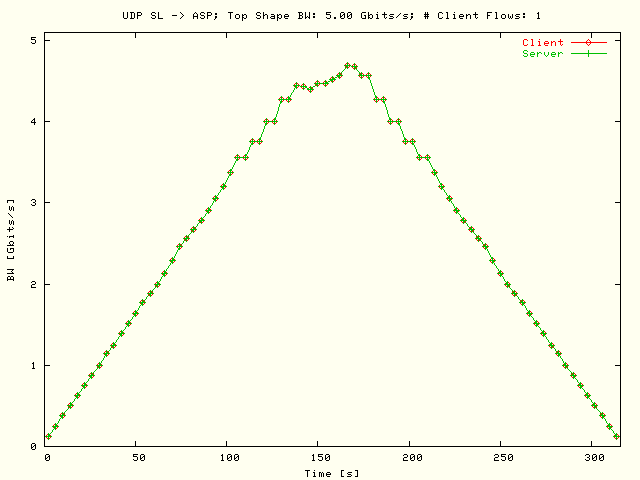
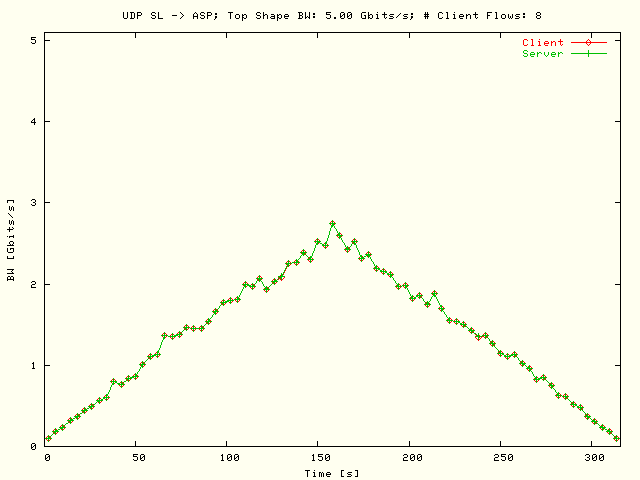
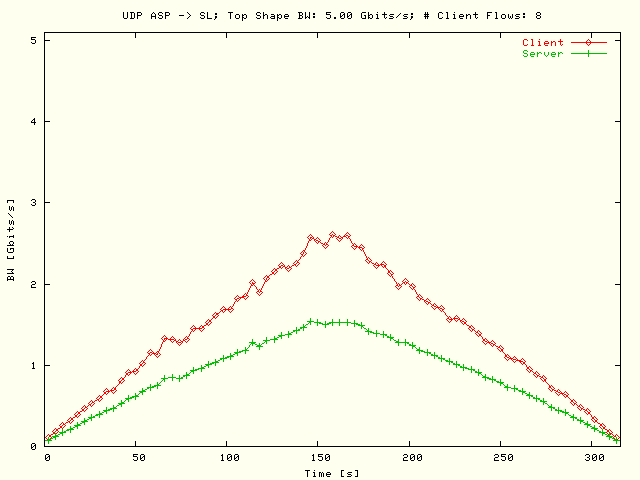
Sum UDP profile bandwidth, taken over the
# parallel flows, as a function of the profile time for the test
direction without rate limiting StarLight ->
Amsterdam Science Park. The top triangle bandwidth is
5 Gbits/s, and one parallel flow has been used. The client and server
bandwidth values have been presented with separate plot
traces. |
| . |
|
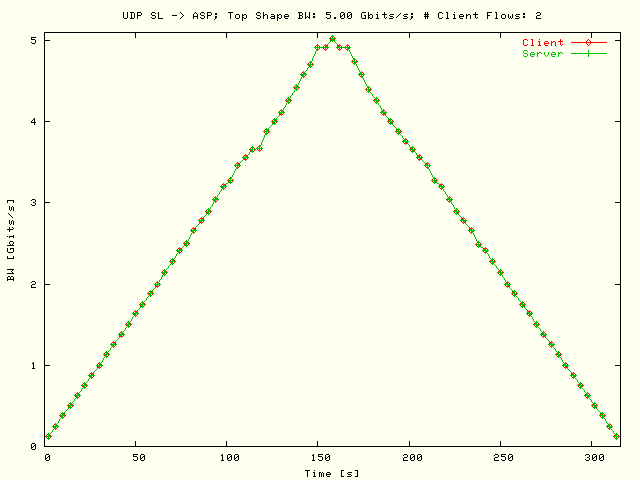
Sum UDP profile bandwidth, taken over the
# parallel flows, as a function of the profile time for the test
direction without rate limiting StarLight ->
Amsterdam Science Park. The top triangle bandwidth is
5 Gbits/s, and two parallel flows have been used. The client and server
bandwidth values have been presented with separate plot
traces. |
| . |
|
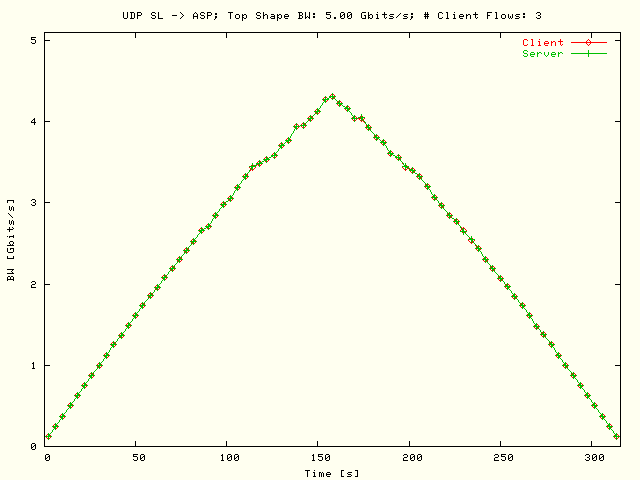
Sum UDP profile bandwidth, taken over the
# parallel flows, as a function of the profile time for the test
direction without rate limiting StarLight ->
Amsterdam Science Park. The top triangle bandwidth is
5 Gbits/s, and three parallel flows have been used. The client and
server bandwidth values have been presented with separate plot
traces. |
| . |
|
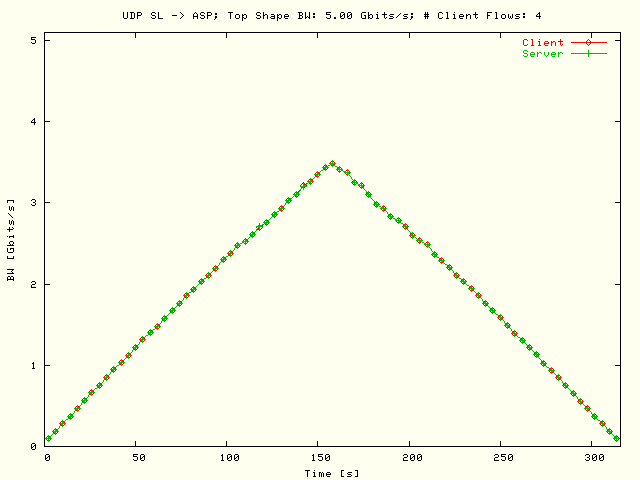
Sum UDP profile bandwidth, taken over the
# parallel flows, as a function of the profile time for the test
direction without rate limiting StarLight ->
Amsterdam Science Park. The top triangle bandwidth is
5 Gbits/s, and four parallel flows have been used. The client and
server bandwidth values have been presented with separate plot
traces. |
| . |
|
Sum UDP profile bandwidth, taken over the
# parallel flows, as a function of the profile time for the test
direction without rate limiting StarLight ->
Amsterdam Science Park. The top triangle bandwidth is
5 Gbits/s, and eight parallel flows have been used. The client and
server bandwidth values have been presented with separate plot
traces. |
Show also the plots from the
,
also including intermediate results that are not presented here, as
in a new browser window.
In the figures shown in the following
subsections the results of the UDP profile tests are presented for the
direction with rate limit, Amsterdam Science Park ->
StarLight. In the
,
these results are presented for a top profile bandwidth of 1, 2, ...,
5 Gbits/s, using one parallel flow.
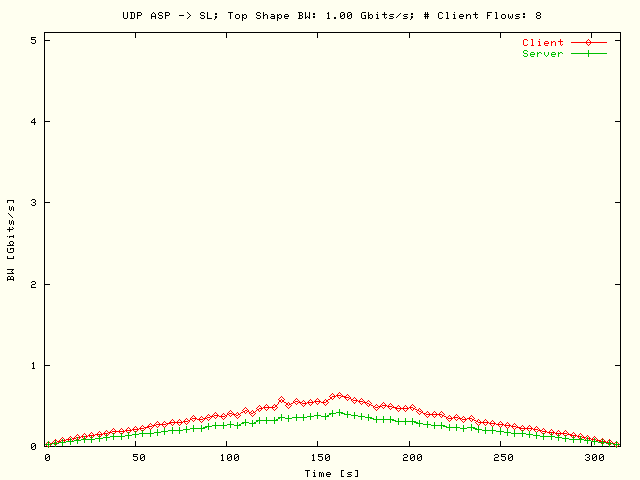
| . |
|
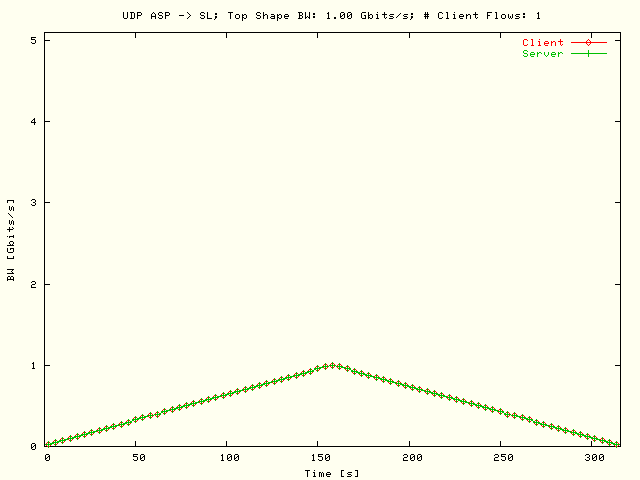
Sum UDP profile bandwidth, taken over the
# parallel flows, as a function of the profile time for the test
direction with rate limiting Amsterdam Science Park ->
StarLight, The top triangle bandwidth is 1 Gbits/s, and one
parallel flow has been used. The client and server bandwidth values have
been presented with separate plot traces. |
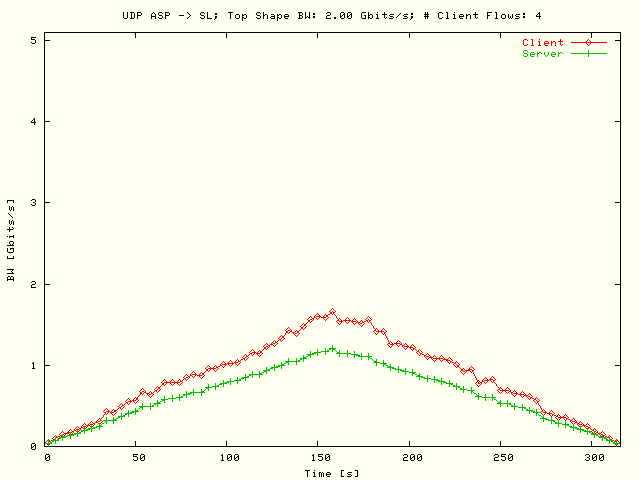
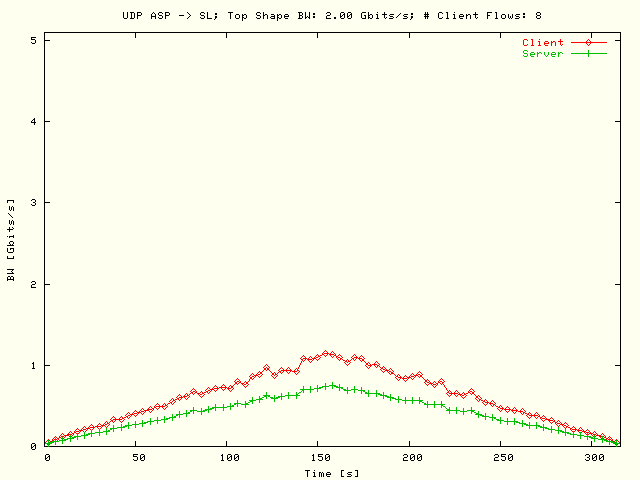
| . |
|
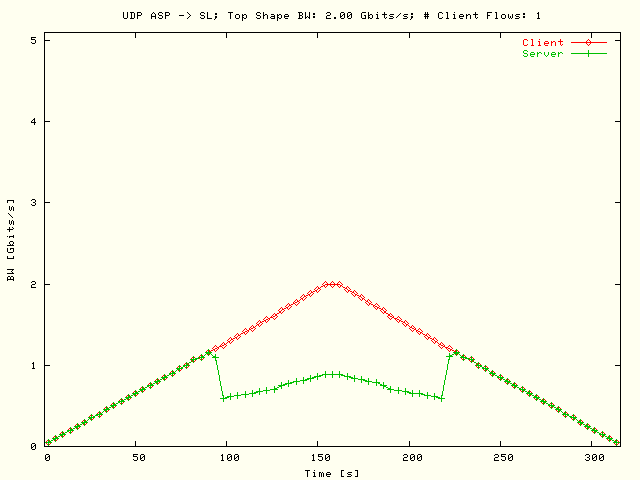
Sum UDP profile bandwidth, taken over the
# parallel flows, as a function of the profile time for the test
direction with rate limiting Amsterdam Science Park ->
StarLight, The top triangle bandwidth is 2 Gbits/s, and one
parallel flow has been used. The client and server bandwidth values have
been presented with separate plot traces. |
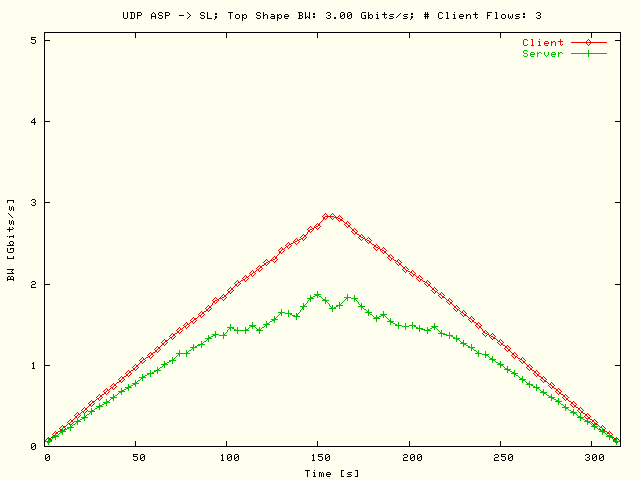
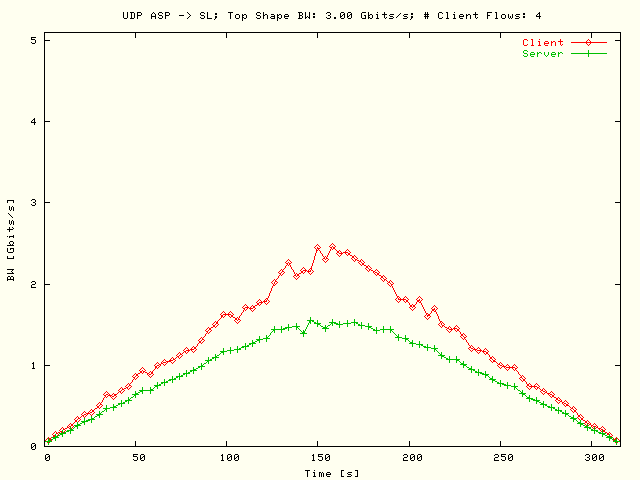
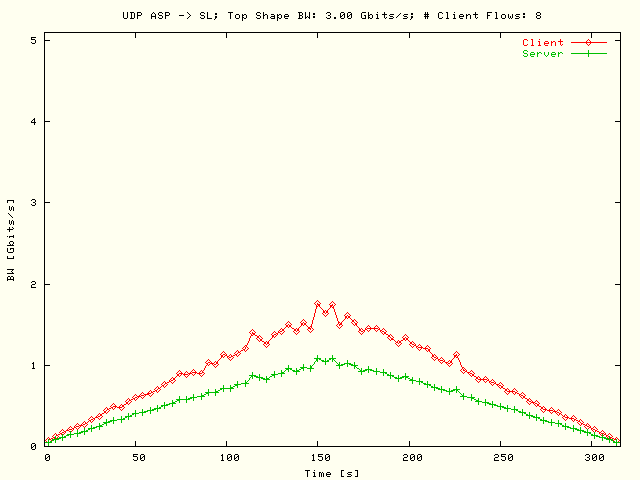
| . |
|
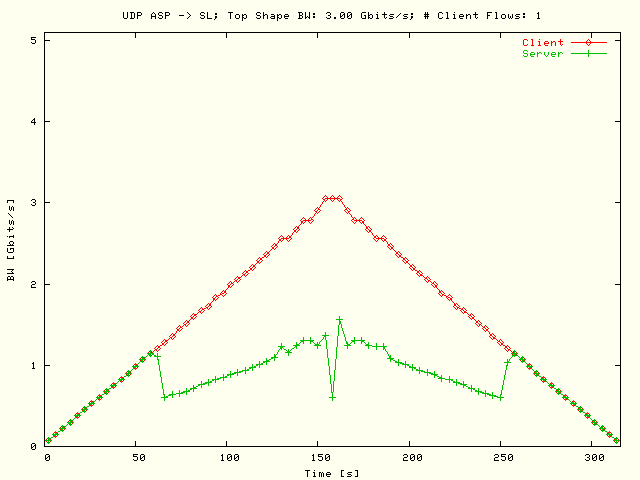
Sum UDP profile bandwidth, taken over the
# parallel flows, as a function of the profile time for the test
direction with rate limiting Amsterdam Science Park ->
StarLight, The top triangle bandwidth is 3 Gbits/s, and one
parallel flow has been used. The client and server bandwidth values have
been presented with separate plot traces. |
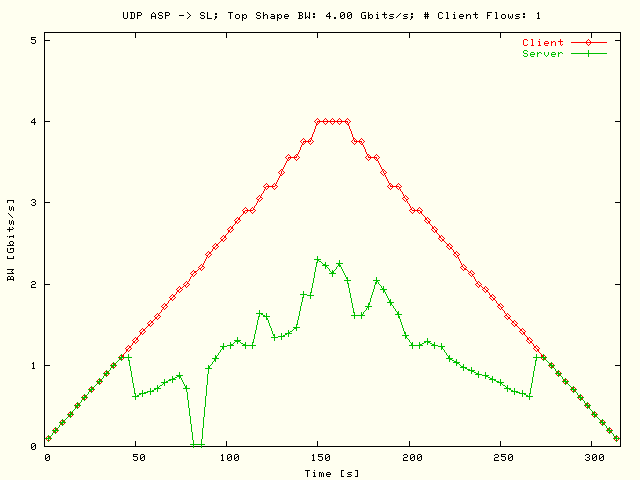
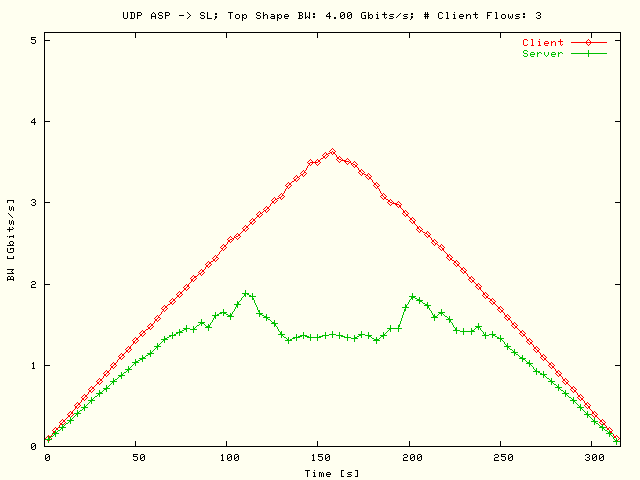
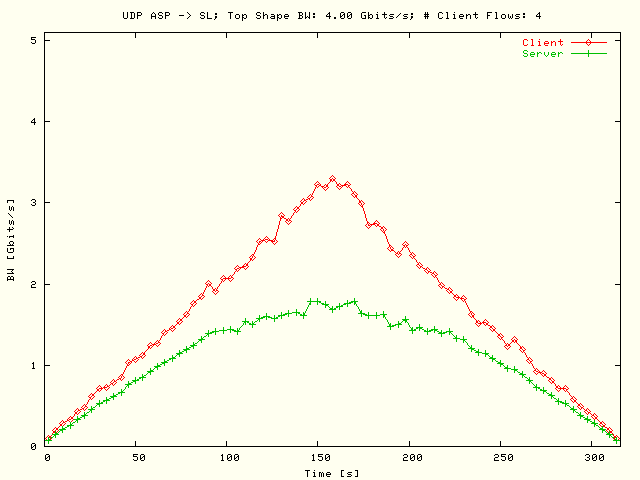
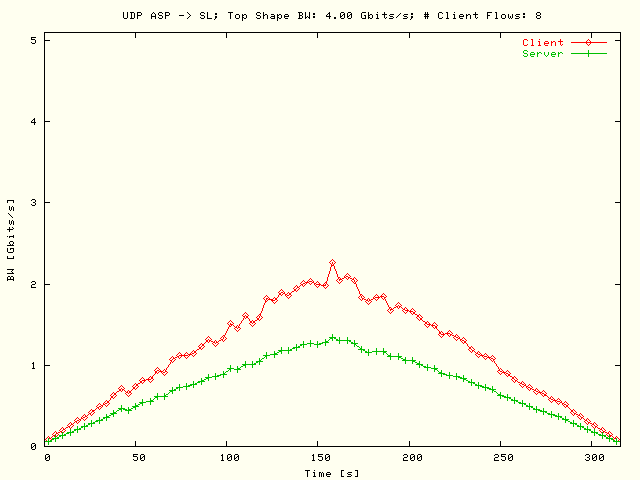
| . |
|
Sum UDP profile bandwidth, taken over the
# parallel flows, as a function of the profile time for the test
direction with rate limiting Amsterdam Science Park ->
StarLight, The top triangle bandwidth is 4 Gbits/s, and one
parallel flow has been used. The client and server bandwidth values have
been presented with separate plot traces. |
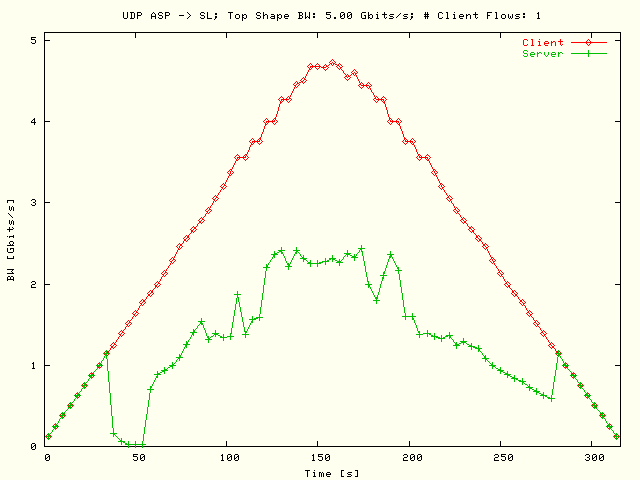
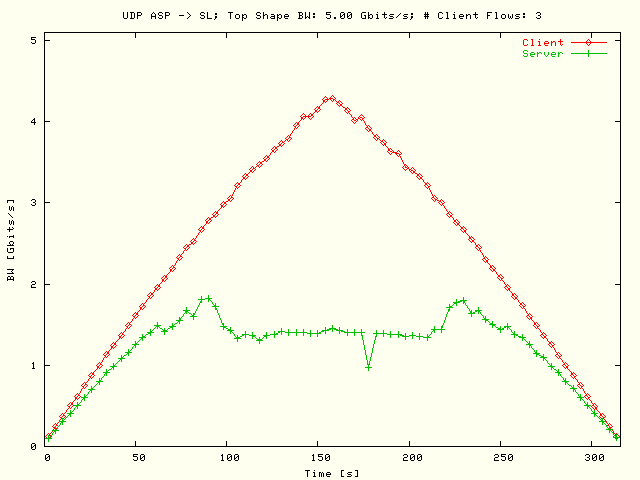
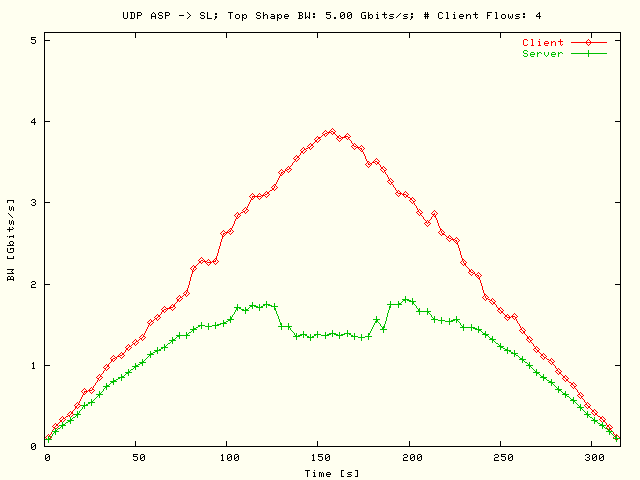
| . |
|
Sum UDP profile bandwidth, taken over the
# parallel flows, as a function of the profile time for the test
direction with rate limiting Amsterdam Science Park ->
StarLight, The top triangle bandwidth is 5 Gbits/s, and one
parallel flow has been used. The client and server bandwidth values have
been presented with separate plot traces. |
Show also the plots from the
,
also including intermediate results that are not presented here, as
in a new browser window.
In the
the equivalent UDP profile bandwidth results in the rate limit direction are
presented as above, but here two
parallel flows has been used.

| . |
|
Sum UDP profile bandwidth, taken over the
# parallel flows, as a function of the profile time for the test
direction with rate limiting Amsterdam Science Park ->
StarLight, The top triangle bandwidth is 1 Gbits/s, and two
parallel flows has been used. The client and server bandwidth values have
been presented with separate plot traces. |
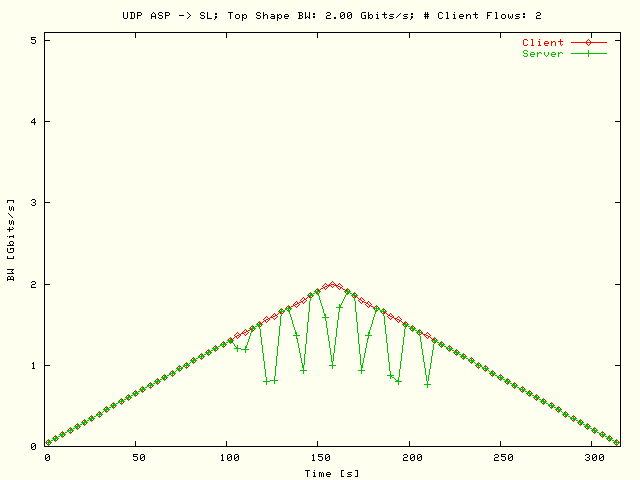
| . |
|
Sum UDP profile bandwidth, taken over the
# parallel flows, as a function of the profile time for the test
direction with rate limiting Amsterdam Science Park ->
StarLight, The top triangle bandwidth is 2 Gbits/s, and two
parallel flows has been used. The client and server bandwidth values have
been presented with separate plot traces. |
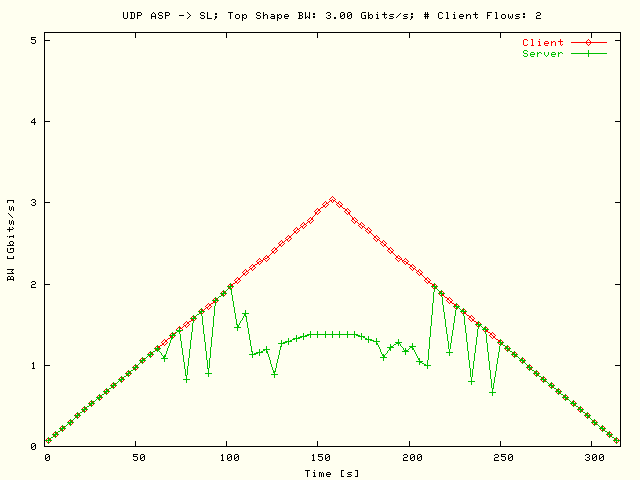
| . |
|
Sum UDP profile bandwidth, taken over the
# parallel flows, as a function of the profile time for the test
direction with rate limiting Amsterdam Science Park ->
StarLight, The top triangle bandwidth is 3 Gbits/s, and two
parallel flows has been used. The client and server bandwidth values have
been presented with separate plot traces. |
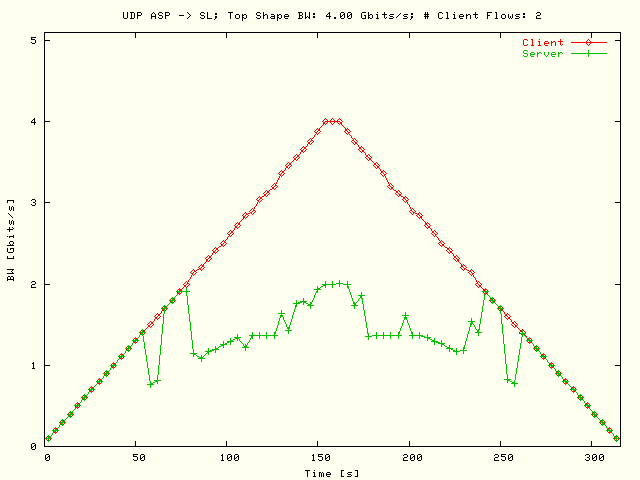
| . |
|
Sum UDP profile bandwidth, taken over the
# parallel flows, as a function of the profile time for the test
direction with rate limiting Amsterdam Science Park ->
StarLight, The top triangle bandwidth is 4 Gbits/s, and two
parallel flows has been used. The client and server bandwidth values have
been presented with separate plot traces. |
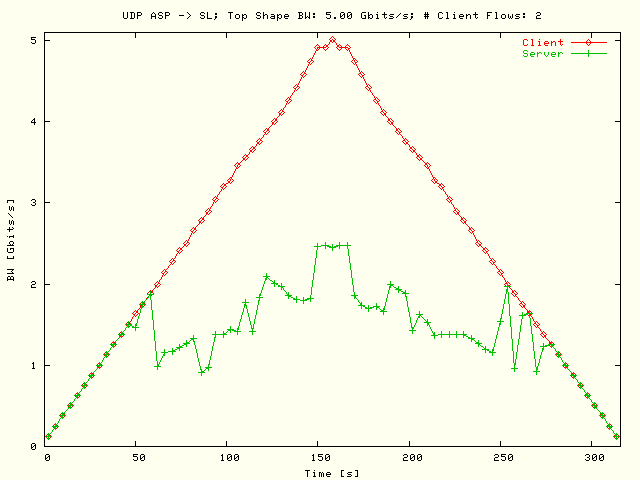
| . |
|
Sum UDP profile bandwidth, taken over the
# parallel flows, as a function of the profile time for the test
direction with rate limiting Amsterdam Science Park ->
StarLight, The top triangle bandwidth is 5 Gbits/s, and two
parallel flows has been used. The client and server bandwidth values have
been presented with separate plot traces. |
Show also the plots from the
,
also including intermediate results that are not presented here, as
in a new browser window.
In the
the equivalent UDP profile bandwidth results in the rate limit direction are
presented as above, but here three
parallel flows has been used.
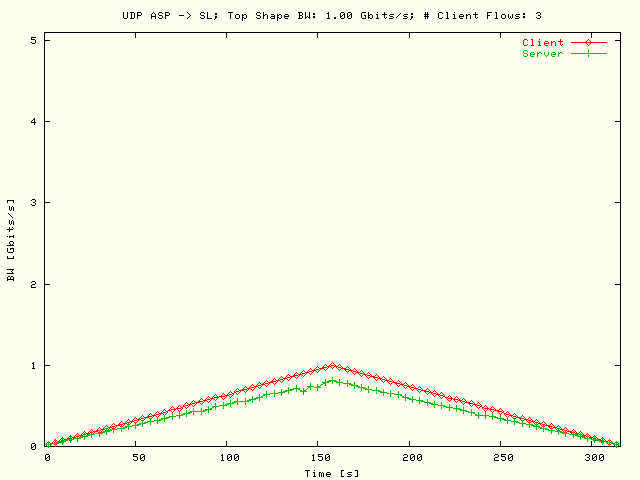
| . |
|
Sum UDP profile bandwidth, taken over the
# parallel flows, as a function of the profile time for the test
direction with rate limiting Amsterdam Science Park ->
StarLight, The top triangle bandwidth is 1 Gbits/s, and three
parallel flows has been used. The client and server bandwidth values have
been presented with separate plot traces. |
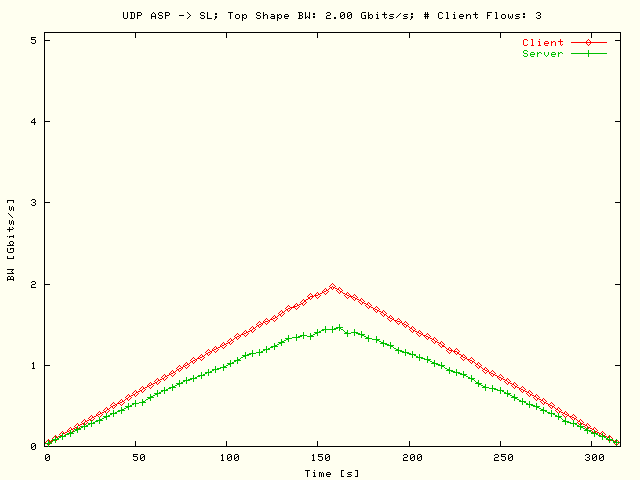
| . |
|
Sum UDP profile bandwidth, taken over the
# parallel flows, as a function of the profile time for the test
direction with rate limiting Amsterdam Science Park ->
StarLight, The top triangle bandwidth is 2 Gbits/s, and three
parallel flows has been used. The client and server bandwidth values have
been presented with separate plot traces. |
| . |
|
Sum UDP profile bandwidth, taken over the
# parallel flows, as a function of the profile time for the test
direction with rate limiting Amsterdam Science Park ->
StarLight, The top triangle bandwidth is 3 Gbits/s, and three
parallel flows has been used. The client and server bandwidth values have
been presented with separate plot traces. |
| . |
|
Sum UDP profile bandwidth, taken over the
# parallel flows, as a function of the profile time for the test
direction with rate limiting Amsterdam Science Park ->
StarLight, The top triangle bandwidth is 4 Gbits/s, and three
parallel flows has been used. The client and server bandwidth values have
been presented with separate plot traces. |
| . |
|
Sum UDP profile bandwidth, taken over the
# parallel flows, as a function of the profile time for the test
direction with rate limiting Amsterdam Science Park ->
StarLight, The top triangle bandwidth is 5 Gbits/s, and three
parallel flows has been used. The client and server bandwidth values have
been presented with separate plot traces. |
Show also the plots from the
,
also including intermediate results that are not presented here, as
in a new browser window.
In the
the equivalent UDP profile bandwidth results in the rate limit direction are
presented as above, but here four
parallel flows has been used.
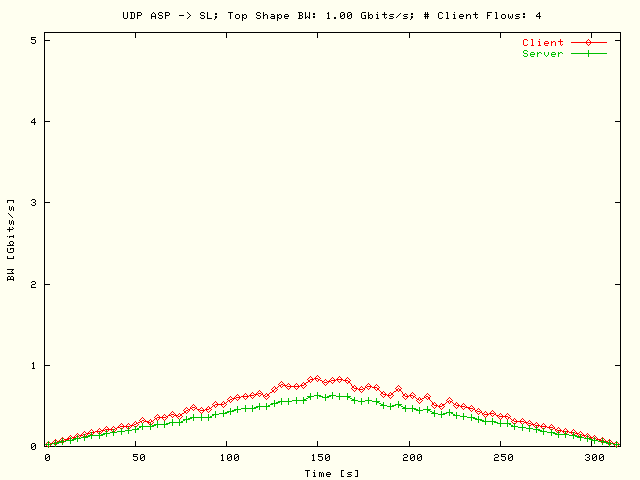
| . |
|
Sum UDP profile bandwidth, taken over the
# parallel flows, as a function of the profile time for the test
direction with rate limiting Amsterdam Science Park ->
StarLight, The top triangle bandwidth is 1 Gbits/s, and four
parallel flows has been used. The client and server bandwidth values have
been presented with separate plot traces. |
| . |
|
Sum UDP profile bandwidth, taken over the
# parallel flows, as a function of the profile time for the test
direction with rate limiting Amsterdam Science Park ->
StarLight, The top triangle bandwidth is 2 Gbits/s, and four
parallel flows has been used. The client and server bandwidth values have
been presented with separate plot traces. |
| . |
|
Sum UDP profile bandwidth, taken over the
# parallel flows, as a function of the profile time for the test
direction with rate limiting Amsterdam Science Park ->
StarLight, The top triangle bandwidth is 3 Gbits/s, and four
parallel flows has been used. The client and server bandwidth values have
been presented with separate plot traces. |
| . |
|
Sum UDP profile bandwidth, taken over the
# parallel flows, as a function of the profile time for the test
direction with rate limiting Amsterdam Science Park ->
StarLight, The top triangle bandwidth is 4 Gbits/s, and four
parallel flows has been used. The client and server bandwidth values have
been presented with separate plot traces. |
| . |
|
Sum UDP profile bandwidth, taken over the
# parallel flows, as a function of the profile time for the test
direction with rate limiting Amsterdam Science Park ->
StarLight, The top triangle bandwidth is 5 Gbits/s, and four
parallel flows has been used. The client and server bandwidth values have
been presented with separate plot traces. |
Show also the plots from the
,
also including intermediate results that are not presented here, as
in a new browser window.
In the
the equivalent UDP profile bandwidth results in the rate limit direction are
presented as above, but here eight
parallel flows has been used.
| . |
|
Sum UDP profile bandwidth, taken over the
# parallel flows, as a function of the profile time for the test
direction with rate limiting Amsterdam Science Park ->
StarLight, The top triangle bandwidth is 1 Gbits/s, and eight
parallel flows has been used. The client and server bandwidth values have
been presented with separate plot traces. |
| . |
|
Sum UDP profile bandwidth, taken over the
# parallel flows, as a function of the profile time for the test
direction with rate limiting Amsterdam Science Park ->
StarLight, The top triangle bandwidth is 2 Gbits/s, and eight
parallel flows has been used. The client and server bandwidth values have
been presented with separate plot traces. |
| . |
|
Sum UDP profile bandwidth, taken over the
# parallel flows, as a function of the profile time for the test
direction with rate limiting Amsterdam Science Park ->
StarLight, The top triangle bandwidth is 3 Gbits/s, and eight
parallel flows has been used. The client and server bandwidth values have
been presented with separate plot traces. |
| . |
|
Sum UDP profile bandwidth, taken over the
# parallel flows, as a function of the profile time for the test
direction with rate limiting Amsterdam Science Park ->
StarLight, The top triangle bandwidth is 4 Gbits/s, and eight
parallel flows has been used. The client and server bandwidth values have
been presented with separate plot traces. |
| . |
|
Sum UDP profile bandwidth, taken over the
# parallel flows, as a function of the profile time for the test
direction with rate limiting Amsterdam Science Park ->
StarLight, The top triangle bandwidth is 5 Gbits/s, and eight
parallel flows has been used. The client and server bandwidth values have
been presented with separate plot traces. |
Show also the plots from the
,
also including intermediate results that are not presented here, as
in a new browser window.
Profile Bandwidth Differences
In this subsection the total differences between the theoretical triangle
profile form shown in
figure 1 from the
"Rate Limit" main section and the client
and server UDP bandwidth values will be presented for the areas defined by the
up and down legs of the triangle. In this way some information could be obtained
if there are hysteresis effects in the system between the up-going and
down-going triangle areas. For symmetry reasons the top bandwidth difference
will be added both to the up-going and down-going areas.
In the
UDP bandwidth profile differences are presented as a function of the top
triangle profile bandwidth using 1, 2, 3, 4 and 8 parallel flows in the
direction without rate limit StarLight ->
Amsterdam Science Park.
| . |
|
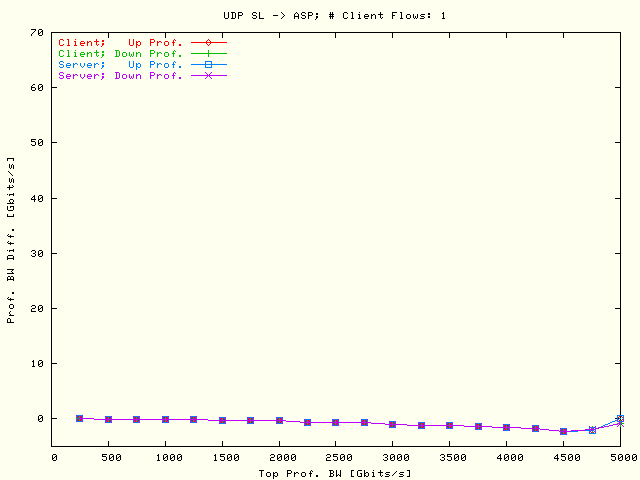
Total UDP bandwidth difference between the
theoretical triangle profile form and the client and server bandwidth values
in the up-going and down-going triangle areas as a function of the top
triangle profile bandwidth in the direction without rate limit
StarLight -> Amsterdam Science Park using one
parallel flow. |
| . |
|
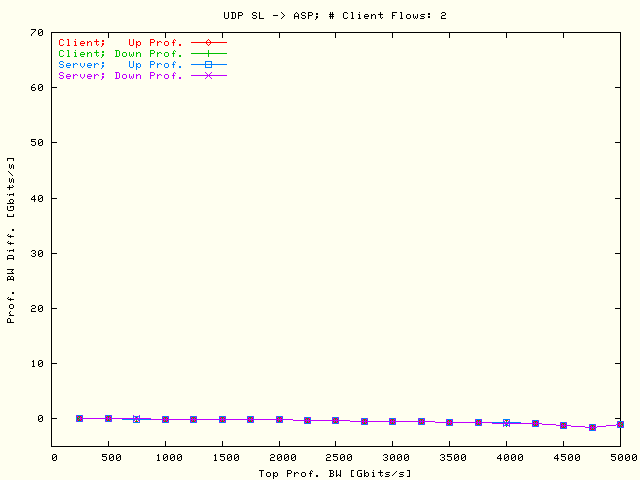
Total UDP bandwidth difference between the
theoretical triangle profile form and the client and server bandwidth values
in the up-going and down-going triangle areas as a function of the top
triangle profile bandwidth in the direction without rate limit
StarLight -> Amsterdam Science Park using two
parallel flows. |
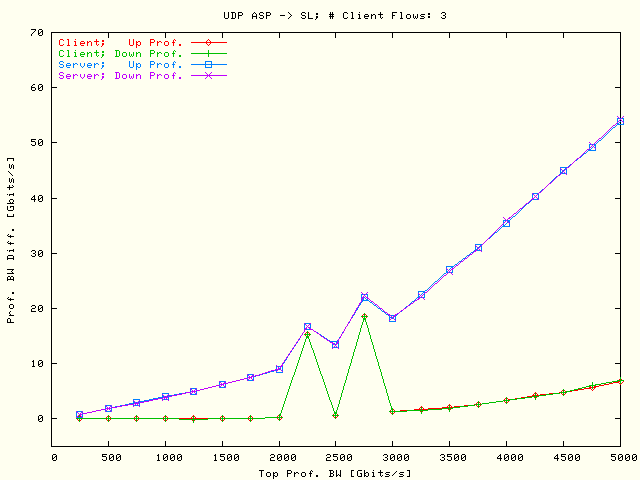
| . |
|
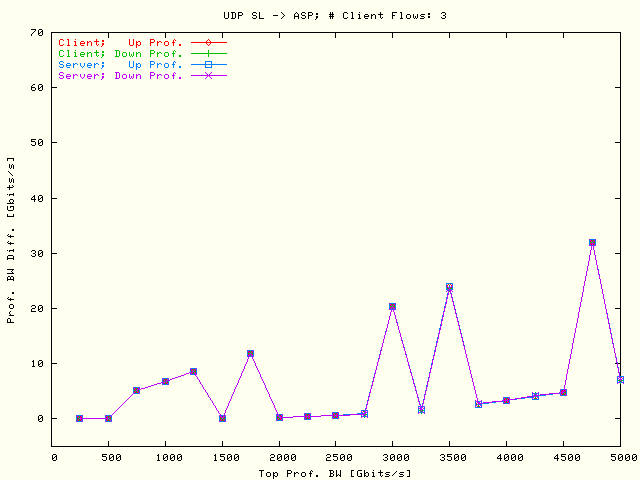
Total UDP bandwidth difference between the
theoretical triangle profile form and the client and server bandwidth values
in the up-going and down-going triangle areas as a function of the top
triangle profile bandwidth in the direction without rate limit
StarLight -> Amsterdam Science Park using three
parallel flows. |
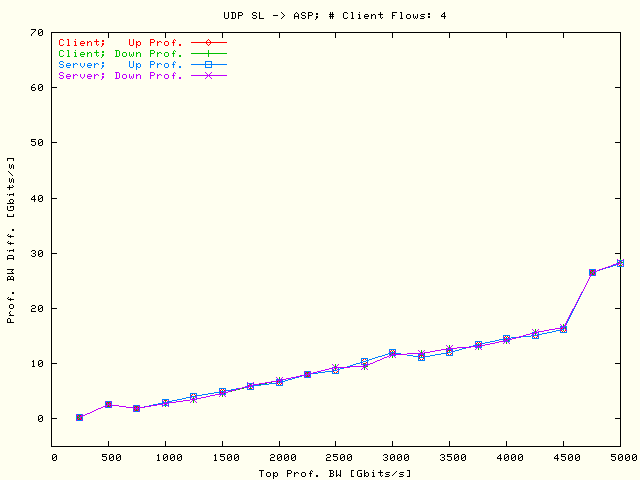
| . |
|
Total UDP bandwidth difference between the
theoretical triangle profile form and the client and server bandwidth values
in the up-going and down-going triangle areas as a function of the top
triangle profile bandwidth in the direction without rate limit
StarLight -> Amsterdam Science Park using four
parallel flows. |
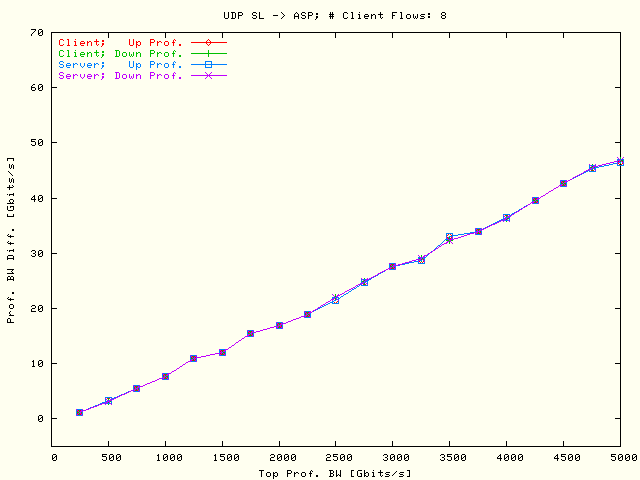
| . |
|
Total UDP bandwidth difference between the
theoretical triangle profile form and the client and server bandwidth values
in the up-going and down-going triangle areas as a function of the top
triangle profile bandwidth in the direction without rate limit
StarLight -> Amsterdam Science Park using eight
parallel flows. |
Show also the plots from the
,
also including intermediate results that are not presented here, as
in a new browser window.
In the
UDP bandwidth profile differences are presented as above but here in the
direction with rate limit Amsterdam Science Park ->
StarLight.
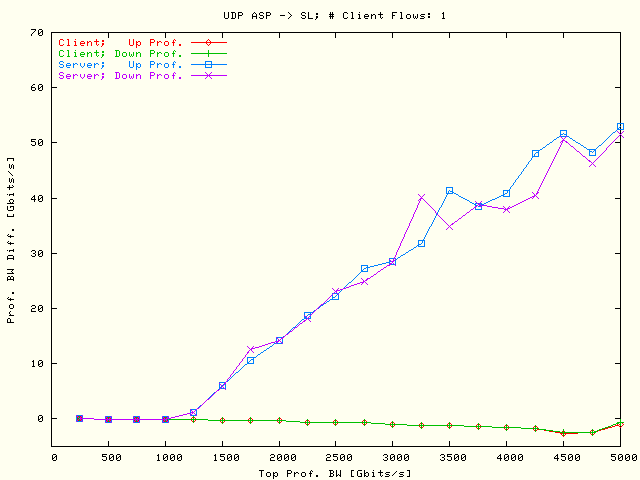
| . |
|
Total UDP bandwidth difference between the
theoretical triangle profile form and the client and server bandwidth values
in the up-going and down-going triangle areas as a function of the top
triangle profile bandwidth in the direction with rate limit
Amsterdam Science Park -> StarLight using one
parallel flow. |
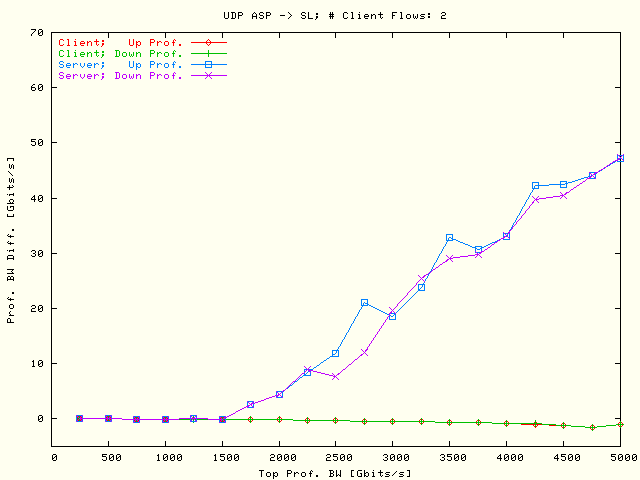
| . |
|
Total UDP bandwidth difference between the
theoretical triangle profile form and the client and server bandwidth values
in the up-going and down-going triangle areas as a function of the top
triangle profile bandwidth in the direction with rate limit
Amsterdam Science Park -> StarLight using two
parallel flows. |
| . |
|
Total UDP bandwidth difference between the
theoretical triangle profile form and the client and server bandwidth values
in the up-going and down-going triangle areas as a function of the top
triangle profile bandwidth in the direction with rate limit
Amsterdam Science Park -> StarLight using three
parallel flows. |
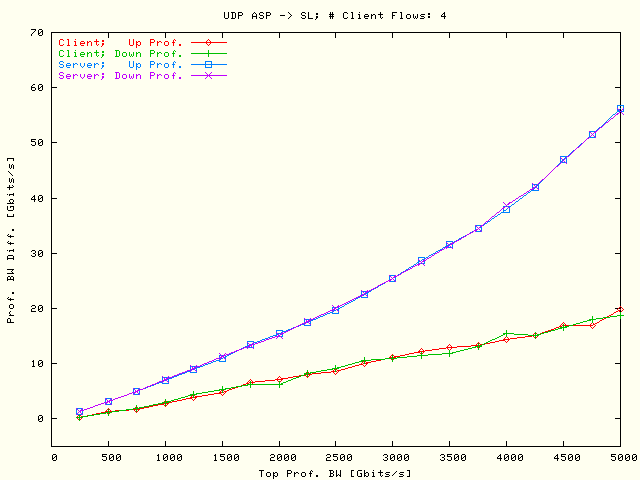
| . |
|
Total UDP bandwidth difference between the
theoretical triangle profile form and the client and server bandwidth values
in the up-going and down-going triangle areas as a function of the top
triangle profile bandwidth in the direction with rate limit
Amsterdam Science Park -> StarLight using four
parallel flows. |
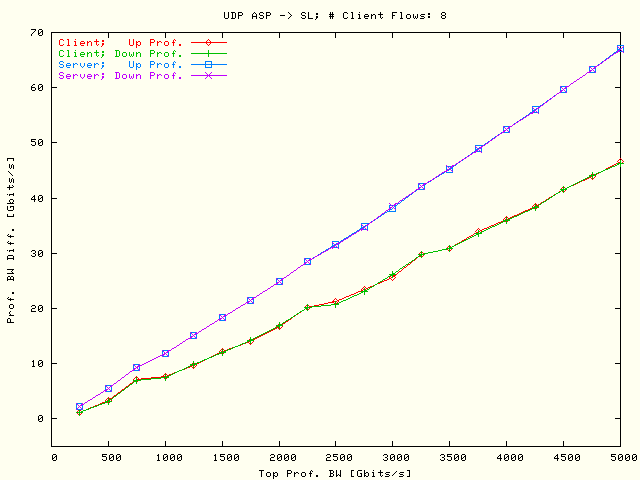
| . |
|
Total UDP bandwidth difference between the
theoretical triangle profile form and the client and server bandwidth values
in the up-going and down-going triangle areas as a function of the top
triangle profile bandwidth in the direction with rate limit
Amsterdam Science Park -> StarLight using eight
parallel flows. |
Show also the plots from the
,
also including intermediate results that are not presented here, as
in a new browser window.
Conclusions
From the UDP profile tests presented in the
the following conclusions can be drawn:
-
No packet lost could be observed in the direction without rate limit
StarLight -> Amsterdam Science Park. When more than
two parallel flows are used the sum of the UDP bandwidth is decreasing
probably due to host limitations.
-
In the direction with rate limit ASP -> SL a
maximum obtained server bandwidth of about 2200 Mbits/s could be found
for one and two parallel flows
().
That is still considerable below the rate limit bandwidth of
2800 Mbits/s. When the # parallel flows are increasing packet lost
for decreasing client bandwidth values could be observed
().
-
In the UDP bandwidth difference plots for the direction without rate limit
SL -> ASP
()
as expected no differences between client and server bandwidths could be
observed. There are also no differences in the results for the up-going and
down-going areas.
-
The UDP bandwidth difference plots for the direction with rate limit
ASP -> SL
()
also show the also previously found increasing packet lost values as a
function of the increasing top bandwidth values and of the increasing
# parallel flows. For the client bandwidths no differences are found
between the up-going and down-going areas. However with one and two parallel
flows and for top bandwidth values ≥ 2500 Mbits/s the profile
bandwidth difference in the up-going area is slightly larger as in the
down-going area. The reason for this is probably a small re-coverage of the
bandwidth after a severe decrease. See for instance the interval bandwidth
.
Besides this no other differences in the up-going and down-going areas for
the server results could be found.