3.5 Modelling skills
Modelling environments
For modelling with the computer, specific modelling environments are available such as Coach1 and Modellus.2 For easy-to-model phenomena, for example free fall, model calculations can also be performed in a spreadsheet program such as Excel.3 For lower secondary education there are modelling tools that do not work with equations, such as SimSketch and Stagecast Creator.4
Two types of modelling environments are distinguished, namely 'text-based' and 'graphical' environments. In the learning environment Coach a model can be constructed both in text mode and in graphical mode. Modellus accepts mathematical formulas. SimSketch and Stagecast Creator are graphical modelling tools
- Text-based modelling
In text-based modelling, there is a direct relationship with the difference equations and other mathematical relations that determine the model. In a text model, initial values are specified and a number of calculation lines are constructed that the computer then repeatedly executes; see the computer model of free fall. In this way, the changes and the new values of all quantities are calculated. The advantage of this is that the student can see what the computer is doing. The disadvantage is that a complex text model quickly becomes unclear. Also the order in which the lines of code are placed becomes important, which makes it more difficult to construct the model. - Graphical modelling
In graphical modelling, one usually attempts to visualise the causal relationships of the model directly in a graphical form, while ignoring the mathematical formulation. For example, in a graphical modelling environment based on system dynamics, developed by Forrester,5 the essential relationships of a dynamic model are represented diagrammatically as in the figure below.
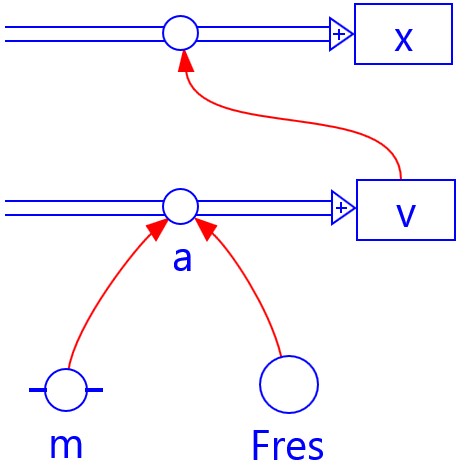
FIG 3.9 Graphical representation of difference equations linked to a dynamic system;
for an explanation of the symbols and relations, see graphical modelling.
For persons who start with modelling, a graphical modelling environment can offer advantages, both when constructing models themselves and when interpreting models.6 An important advantage is that it supports students in understanding the model, in particular the coherence between the different variables. Moreover, advanced integration algorithms, such as the Runge-Kutta method, can be applied without the need to know these algorithms explicitly and without changing the model structure.
Drawback of the graphical representation is that the underlying equations are not immediately visible and that it is not clear how the model is calculated by the computer. As a result, students gain less insight into the mathematical structure of the model. Therefore, explicit attention must be paid to the relationship between the graphical model structure and the associated mathematical computational model (In the modelling environment Coach 7, the model equations can easily be made visible in graphical mode1). If this is not done sufficiently, many students will not be able to construct models independently.7
An amalgam of text-based and graphical modelling seems to be the best option for modelling education. An approach may be to take the mathematical relationships as the starting point for the model construction in graphical modelling.8 This helps overcome the above problem of poor insight into the mathematical meaning of the graphical elements. It is advisable to allow students starting with modelling to calculate a few computation cycles by hand. If this approach is followed, students appear to find textual models superfluous.