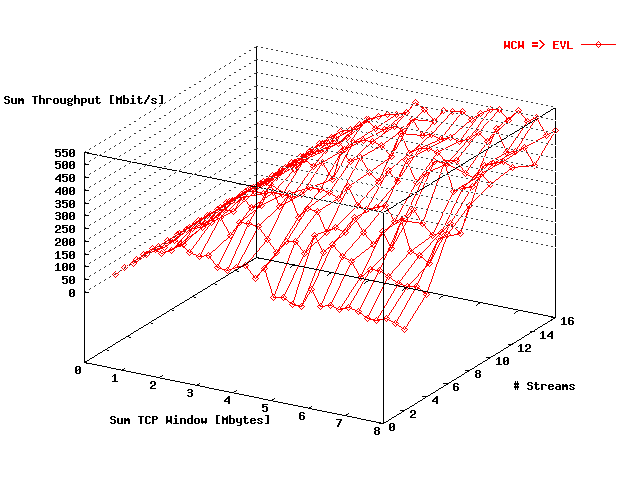
| Figure 1. | Sum throughput SARA => EVL as function of the total window size and the # streams. |
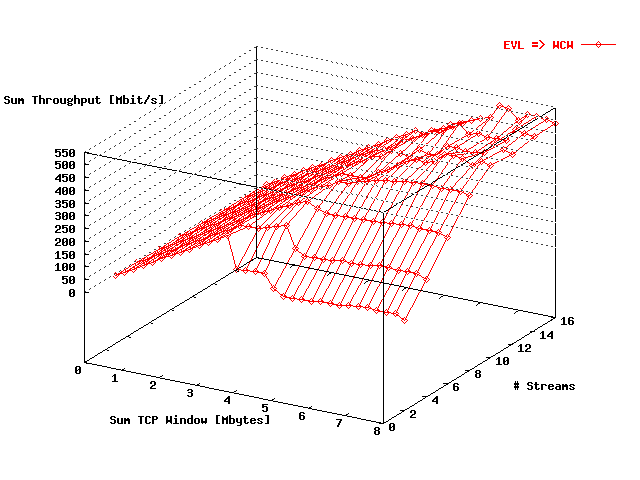
| Figure 2. | Sum throughput EVL => SARA as function of the total window size and the # streams. |
In this document some results are presented obtained with TCP and UDP measurements at the Lambda between SURFnet, Amsterdam, and StarLight, Chicago, as part of the Netherlight project.
When not mentioned differently, the tests were executed between the following hosts:
| Host | Location | OS |
| prusin.sl.startap.net | EVL, Chicago | Linux 2.4.X |
| reynolds.sl.startap.net | EVL, Chicago | Linux 2.4.X |
| 145.146.0.1 | SARA, Amsterdam | Linux 2.2.X |
| 145.146.0.65 | SARA, Amsterdam | Linux 2.2.X |
Throughput tests were performed from the two hosts at EVL to the two hosts at SARA, and reversely. At each host one to eight streams were started to the equivalent host at the other location. During these test the sum of the TCP window sizes over the streams was maximal 8 Mbyte. The duration of each test was 60 s. The TCP streams were generated using Iperf, because this tool can easily handle multiple streams. A special script has been used to start the streams at both source hosts more or less at the same time, using the remote secure shell mechanism.
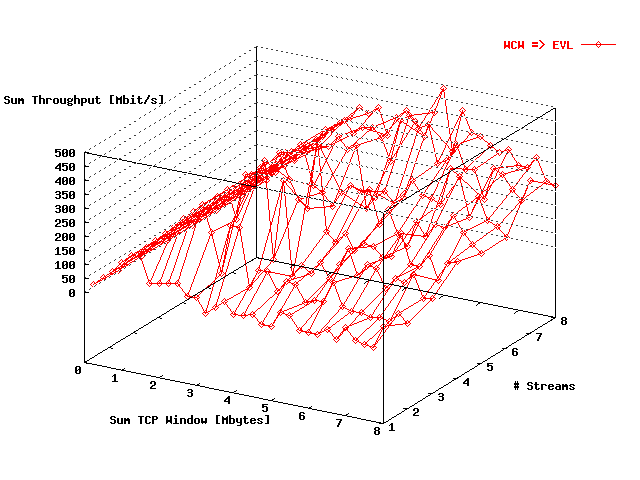
In the figures, displayed below, the sum of the TCP throughput values over all streams are presented as a function of the sum of the TCP window sizes taken over all source hosts (the destination window sizes are identical) and as a function of the total # streams.
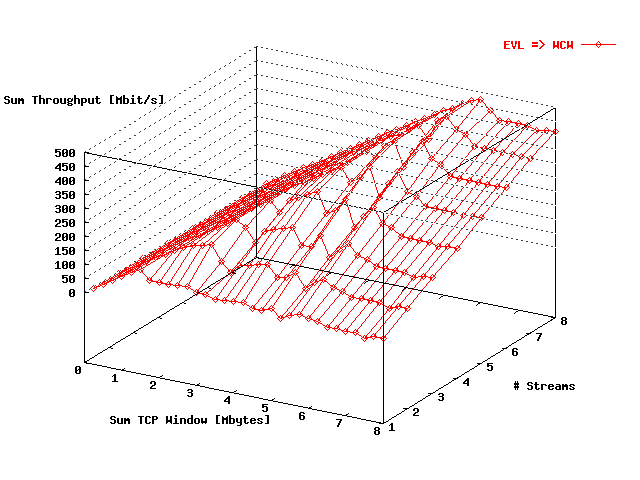
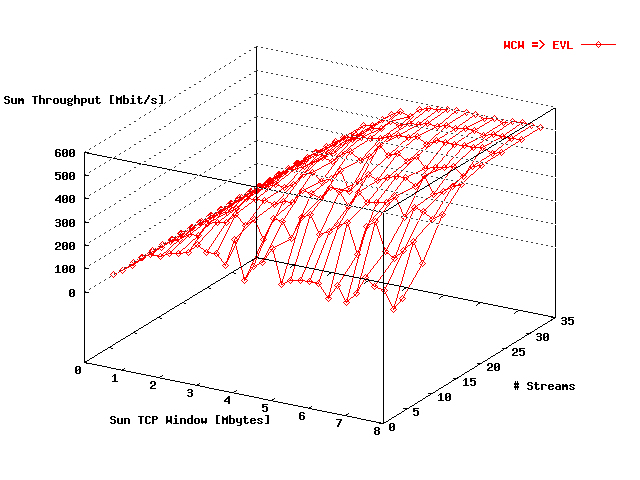
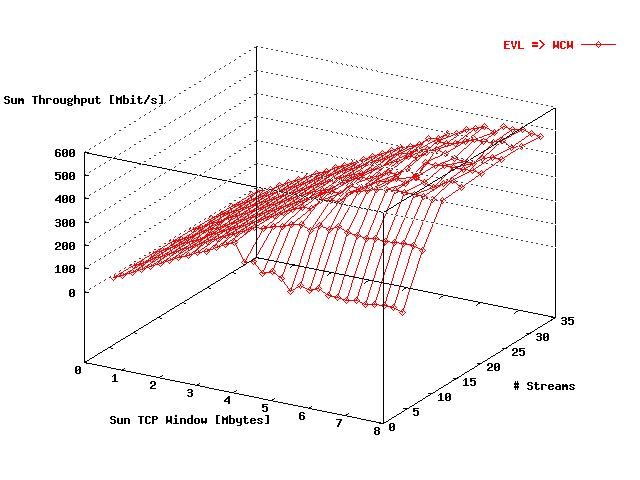
Figure 1 displays in a 3D figure the throughput as a function of the total window size and the # streams in the direction SARA => EVLIn figure 2 these data are presented for the reverse direction.
| Figure 1. | Sum throughput SARA => EVL as function of the total window size and the # streams. |
| Figure 2. | Sum throughput EVL => SARA as function of the total window size and the # streams. |
From figures 1 and 2, there follows that the maximum throughput is about 500 Mbit/s.
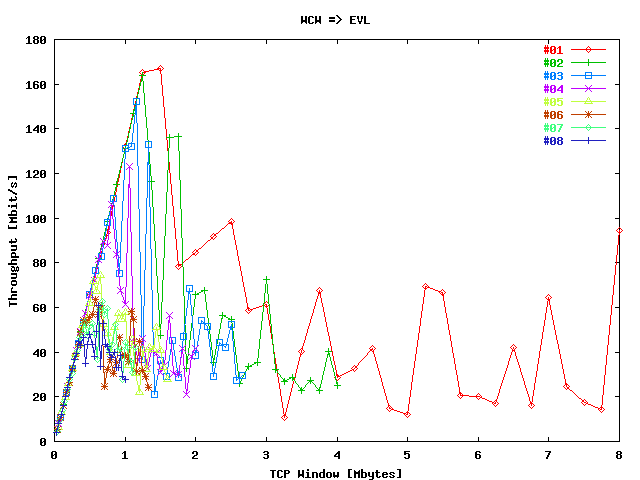
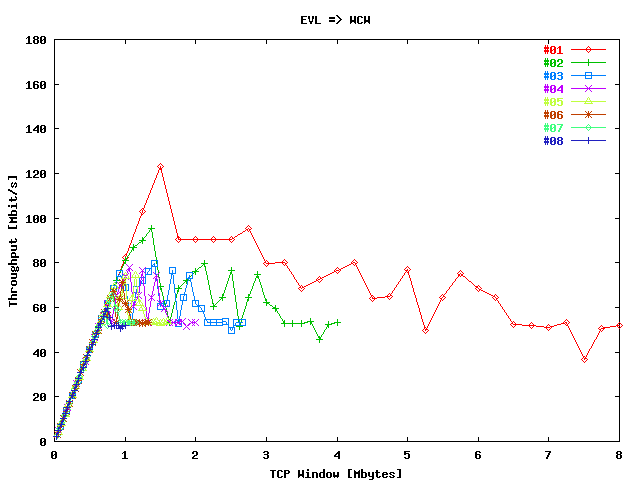
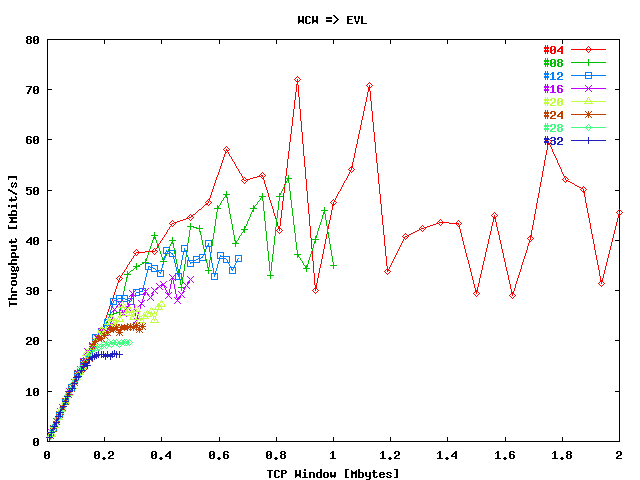
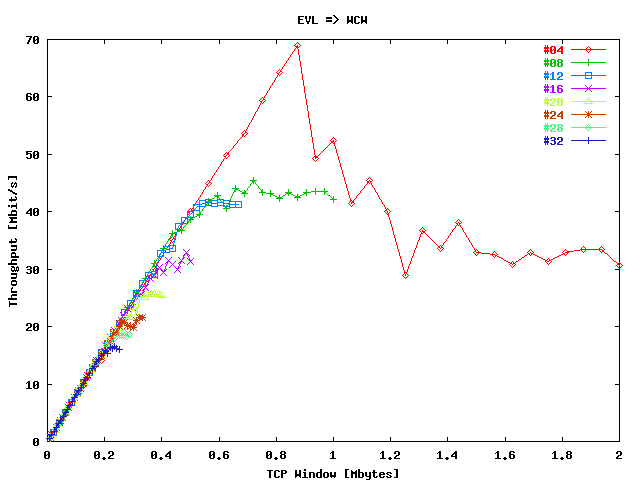
In figure 3 the mean throughput per stream has been given as function of the TCP window size per stream in the direction SARA -> EVL. Each # streams is represented in this plot by a trace. Figure 4 displays these results in the reverse direction.
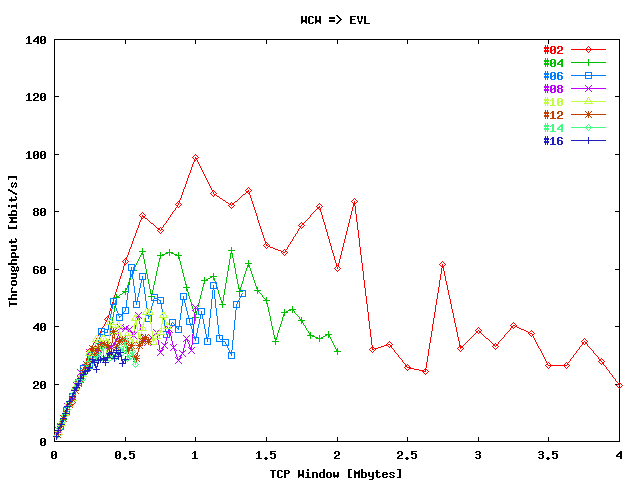
| Figure 3. | Throughput per stream in the direction SARA => EVL as function of the window size per stream. |
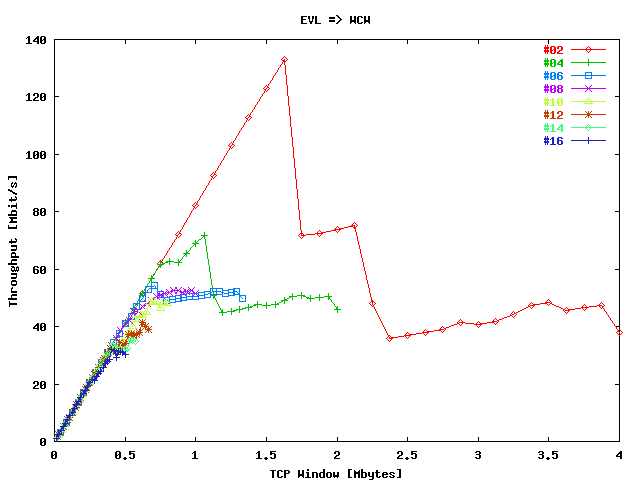
| Figure 4. | Throughput per stream in the direction EVL => SARA as function of the window size per stream. |
From figures 3 and 4 it follows that before congestion occurs the increase in throughput is reasonable in correspondence with the equation Tput = TCP-Win * RTT . In figure 3, the increase is faster than in this equation.
With an increase of the # streams the performance is becoming better. The reason is that in that case the individual TCP window sizes can be selected smaller which limits the memory required at the routers and hosts.
UDP bandwidth tests were performed from the two hosts at EVL to the two hosts at SARA, and inversely. At each host one to eight streams were started to the equivalent host at the other location. During these test the sum of the bandwidth send over the streams was maximal 700 Mbit/s. The duration of each test was 60 s. The UDP streams were generated using Iperf.
Figure 5 displays the percentage total packets lost as function of the total bandwidth send in the direction SARA => EVL. Each # streams is presented in this plot by a separate trace. Figure 6 displays the results for the reverse direction.
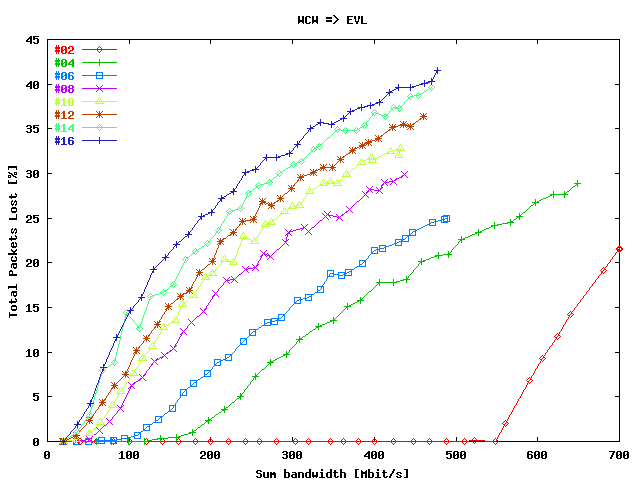
| Figure 5. | Total packets lost in the direction SARA => EVL as function of the sum of the bandwidths. |
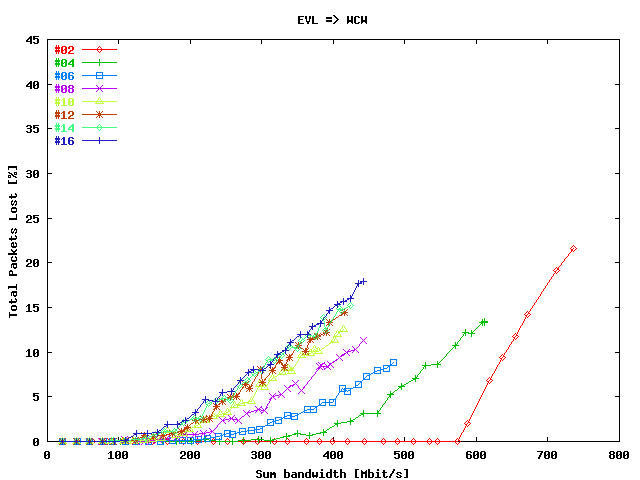
| Figure 6. | Total packets lost in the direction EVL => SARA as function of the sum of the bandwidths. |
From the figures 5 and 6, it follows that two streams with a maximum bandwidth of about 550 Mbit/s could be send without package lost. With an increasing # streams the performance becomes worse, but that may be host effects.
In this section the results are presented of equivalent tests as in the first TCP section. The only difference is that only one stream is generated here. Used hosts were prusin.sl.startap.net and 145.146.0.65.
The results presented in the figures below are comparable with the plots listed in the first TCP section. In these tests 1, 2, ..., 8 streams are used.
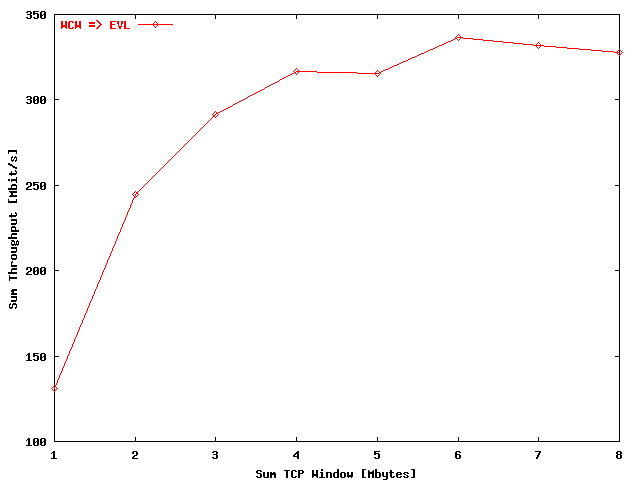
| Figure 7. | Sum throughput SARA => EVL with one host pair as function of the total window size and the # streams. |
| Figure 8. | Sum throughput EVL => SARA with one host pair as function of the total window size and the # streams. |
| Figure 9. | Throughput per stream in the direction SARA => EVL with one host pair as function of the window size per stream. |
| Figure 10. | Throughput per stream in the direction EVL => SARA with one host pair as function of the window size per stream. |
In this section the results are presented of equivalent tests as in the first TCP section. The only difference is that at SARA also the equivalent hosts 145.146.0.2 and 145.146.0.66 were participating in the tests, resulting in the following streams: prusin.sl.startap.net <=> { 145.146.0.1, 145.146.0.65 } and reynolds.sl.startap.net <=> { 145.146.0.2, 145.146.0.66 }.
The results presented in the figures below are comparable with the plots listed in the first TCP section. In these tests 4, 8, ..., 32 streams are used. Due to the larger number participating hosts the performances are slightly better than in the previous TCP tests.
| Figure 11. | Sum throughput SARA (4 hosts) => EVL (2 hosts) as function of the total window size and the # streams. |
| Figure 12. | Sum throughput EVL (2 hosts) => SARA (4 hosts) as function of the total window size and the # streams. |
From figures 7 and 8, there follows that the maximum throughput is about 550 Mbit/s.
| Figure 13. | Throughput per stream in the direction SARA (4 hosts) => EVL (2 hosts) as function of the window size per stream. |
| Figure 14. | Throughput per stream in the direction EVL (2 hosts) => SARA (4 hosts) as function of the window size per stream. |
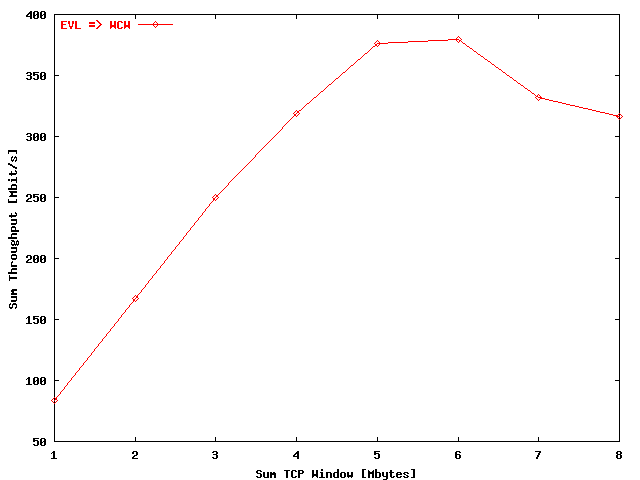
In this section the results of long duration, single TCP stream tests are presented as function of the TCP window size. Used hosts were prusin.sl.startap.net and 145.146.0.65. The test duration was 60 minutes. The results are presented in the figures below.
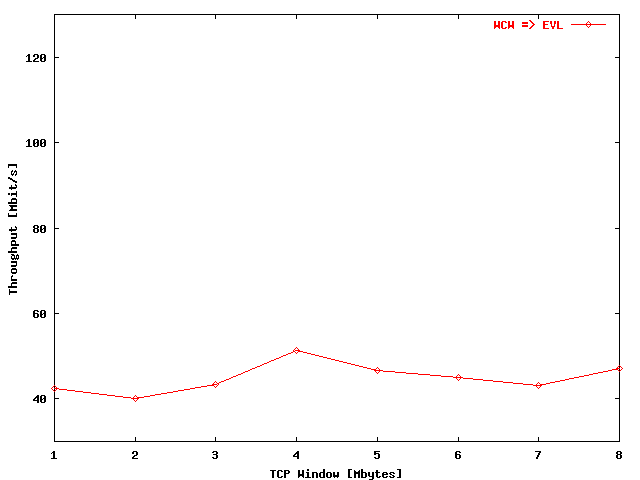
| Figure 15. | Single stream throughput SARA => EVL as function of the window size. Test duration: 60 minutes. |
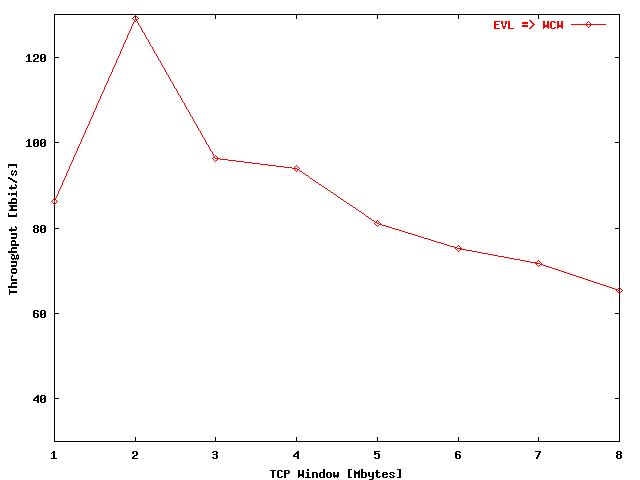
| Figure 16. | Single stream throughput EVL => SARA as function of the window size. Test duration: 60 minutes. |
In this section the results of long duration, four TCP stream tests are presented as function of the TCP window size. Used hosts were prusin.sl.startap.net and 145.146.0.65. The test duration was 60 minutes. The results are presented in the figures below.
| Figure 17. | Four stream throughput SARA => EVL as function of the window size. Test duration: 60 minutes. |
| Figure 18. | Four stream throughput EVL => SARA as function of the window size. Test duration: 60 minutes. |
Compared with the single stream situation, the performance is with four streams much better and more in correspondence with the theoretical expectations.