Lambda TCP / UDP Tests after Host Upgrade to 512 MB
In this document some results are presented obtained with TCP and
UDP measurements at the Lambda between
SURFnet, Amsterdam, and
StarLight, Chicago, as part of
the
Netherlight project. The results displayed here are obtained after the
upgrade of the ONS and after the memory of the hosts located at
SARA, Amsterdam, have been upgraded from
128 MB to 512 MB. See also the
results before the ONS upgrade and the
results before the memory upgrade.
The tests were executed between the following hosts:
TCP Tests
For the TCP throughput tests the usual topology has been used with two
VLAN's with two hosts each, ranging from the SSR 8000 at
SARA, Amsterdam, as far as the LSR 6509
at Chicago. The EVL hosts were
located in a third VLAN. The TCP streams at these tests were generated
by Iperf, because this tool
can easily handle multiple streams. A special script has been used to start the
streams at multiple hosts more or less simultaneously using the remote
secure shell mechanism. The details of
these tests are described in the following sections.
VLAN WCW 1 <=> VLAN EVL
Setup
In this setup throughput tests were performed between the hosts
gwgsara2 and gwgsara3,
both located in VLAN WCW 1 at
SARA and the hosts
prusin and reynolds,
located at the EVL VLAN. The
tests were performed with one or two host pairs. The maximum
TCP window size per host was 16 Mbyte. The duration of each test
was 60 s.
Results
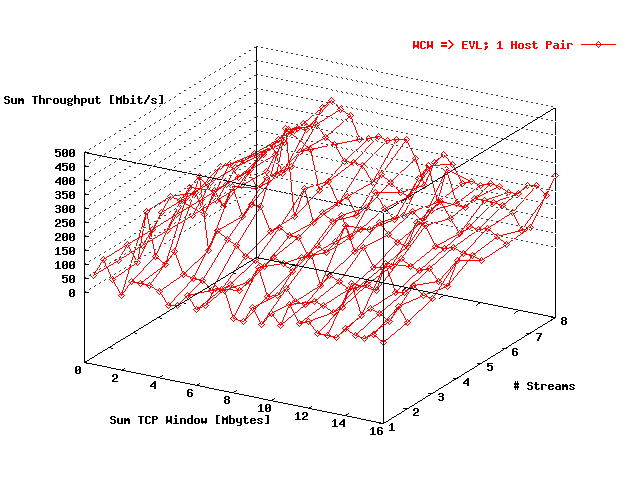
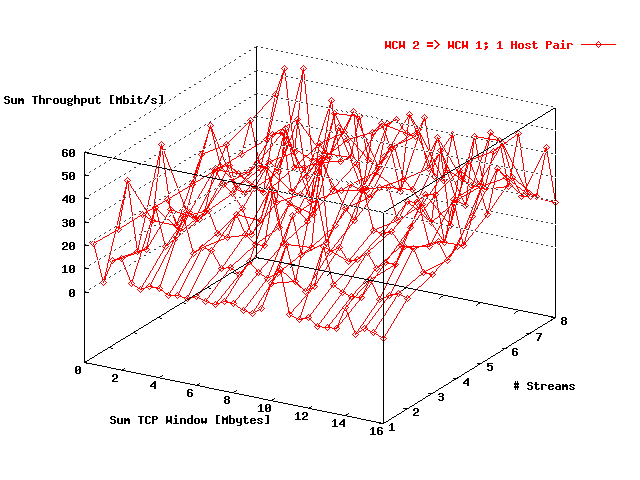
In the 3D figures, displayed below, the sum of the TCP throughput
values, taken over all streams, is presented as a function of the sum of the
TCP window size, also taken over all streams, and as a function of the
total # streams. Source and destination TCP window sizes are
chosen identical.
displays these data for the streams from source host
gwgsara3 to destination host
reynolds. In
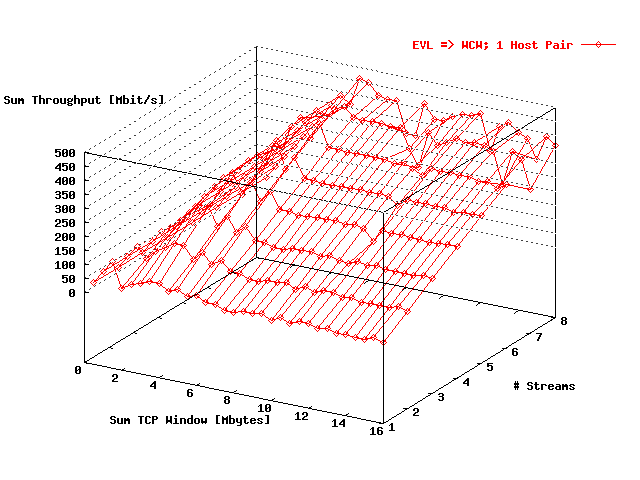
these data are presented for the reverse direction.
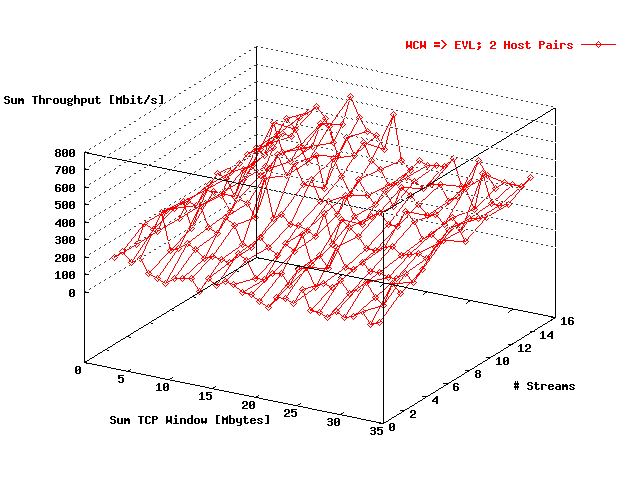
shows the 3D throughput data for the two host pairs in the direction VLAN
WCW 1 => VLAN EVL, while in
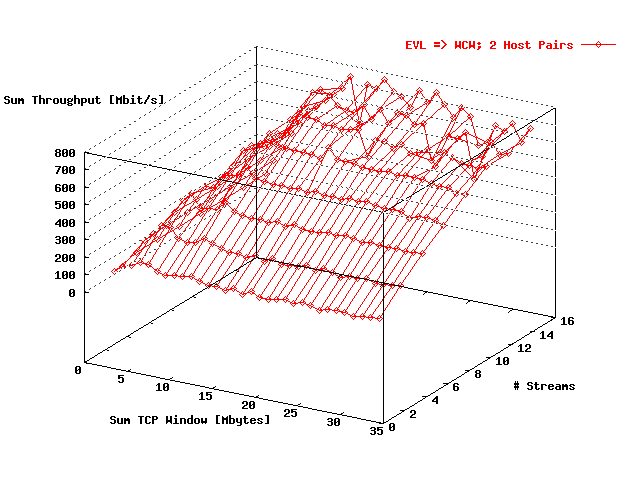
the reverse direction is presented.
| . |
|
Sum throughput for one host pair in the direction
gwgsara3 =>
reynolds as a
function of the total window size and the
# streams. |
| . |
|
Sum throughput for one host pair in the direction
reynolds =>
gwgsara3 as a
function of the total window size and the
# streams. |
| . |
|
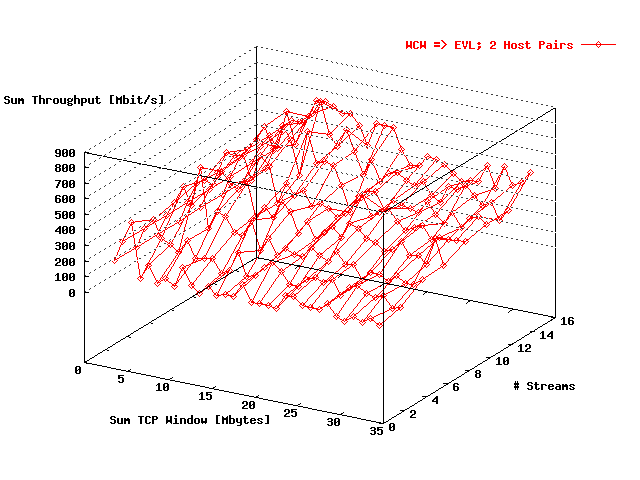
Sum throughput for two host pairs in the direction
WCW 1 => EVL as a
function of the total window size and the
# streams. |
| . |
|
Sum throughput for two host pairs in the direction
EVL => WCW 1 as a
function of the total window size and the
# streams. |
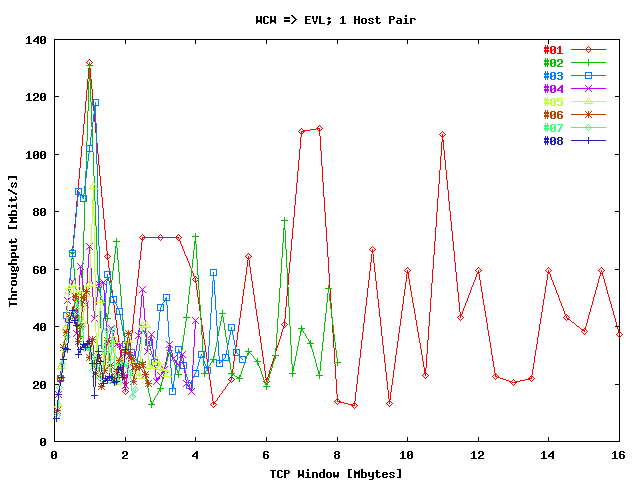
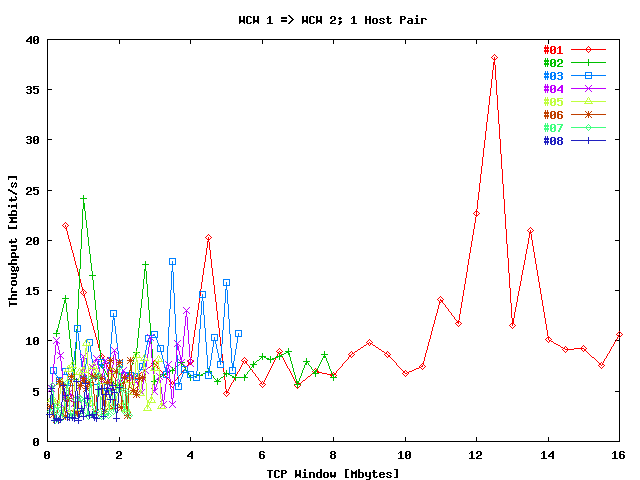
In
the mean throughput per stream has been given as function of the
TCP window size from source host
gwgsara3 to destination host
reynolds. The data for each # streams are
represented in this plot by a trace.
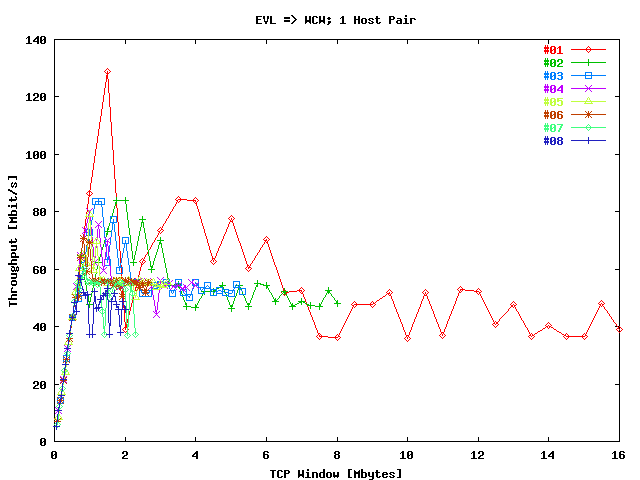
supplies these data for the reverse direction.
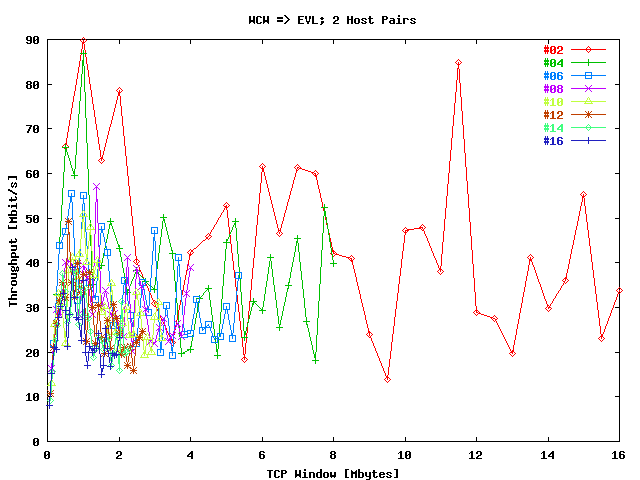
gives the mean throughput data for two host pairs in the VLAN direction
WCW 1 => EVL, while in
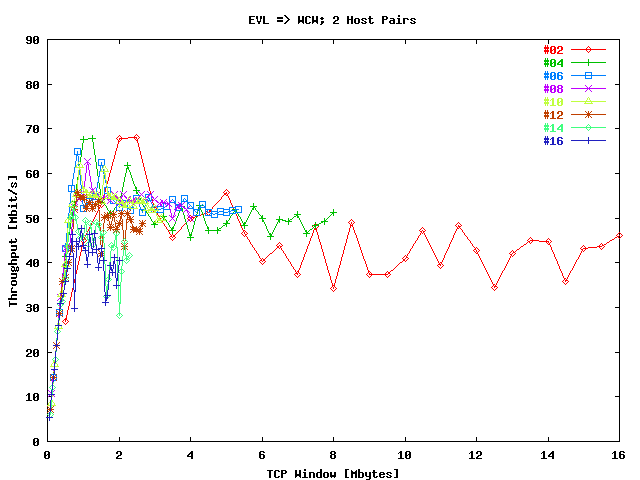
these data are shown for the reverse direction.
| . |
|
Throughput per stream for one host pair in the
direction
gwgsara3 =>
reynolds as
function of the window size per stream. |
| . |
|
Throughput per stream for one host pair in the
direction
reynolds =>
gwgsara3 as
function of the window size per stream. |
| . |
|
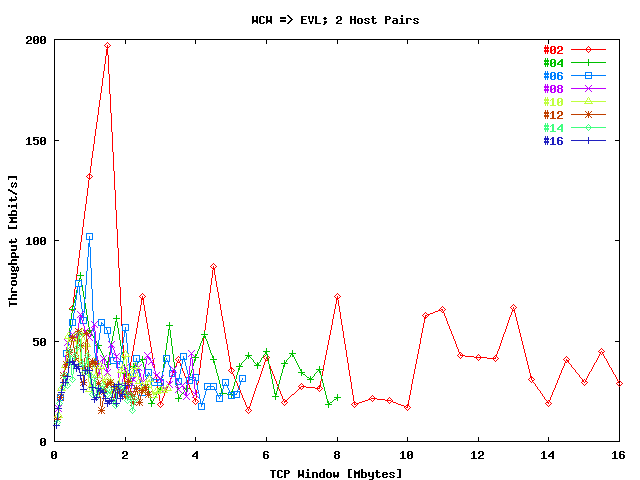
Throughput per stream for two host pairs in the
direction WCW 1 => EVL as
function of the window size per stream. |
| . |
|
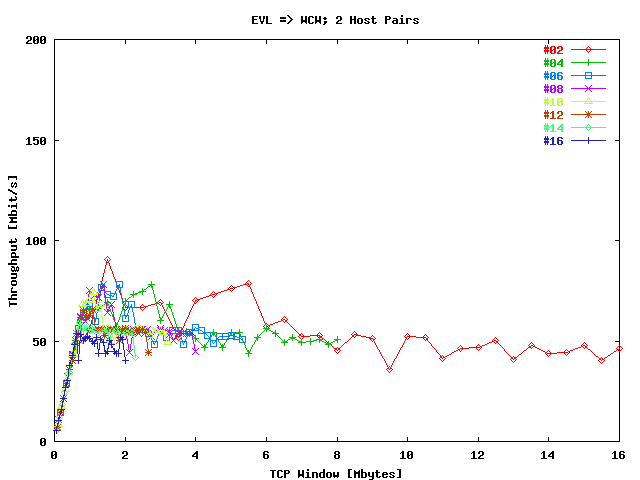
Throughput per stream for two host pairs in the
direction EVL => WCW 1 as
function of the window size per stream. |
Conclusions
From
, ...,
the following conclusions can be drawn:
-
The performance in the direction EVL => WCW is
better than in the reverse direction. This phenomenon is also seen in the
tests before the ONS upgrade and
before the memory upgrade. It is probably due to
host effects.
-
There is no improvement in performance when TCP window and socket
buffer sizes larger than 4 Mbyte are selected. With the observed
round-trip time of nearly 100 ms, an optimal TCP window of
about 10 Mbyte might be expected.
VLAN's WCW 1 & 2 <=> VLAN EVL
Setup
The throughput tests, described in this subsection, were executed from the
SARA hosts
gwgsara2 in VLAN WCW 1 and
gwgsara4 in VLAN WCW 2 to the
EVL hosts
prusin and reynolds,
both situated in the same VLAN. Also measurements in the reverse direction were
performed. All tests were executed with two host pairs. The maximum window size
per host was 16 Mbyte. The test duration per stream was 60 s.
Results
In the 3D figures below the sum of the TCP throughput has been
given for this setup as a function of the TCP window sizes sum and of
the total # streams.
displays these data in the direction
WCW => EVL. In
the results of the reverse direction are presented.
| . |
|
Sum throughput for two host pairs in the direction
WCW 1 & 2 =>
EVL as a function of the total window size and
the # streams. |

| . |
|
Sum throughput for two host pairs in the direction
EVL =>
WCW 1 & 2 as a function of
the total window size and the
# streams. |
shows the mean throughput per stream as function of the TCP window size
for the direction WCW => EVL. In
these data are presented for the reverse direction.
| . |
|
Throughput per stream for two host pairs in the
direction
WCW 1 & 2 =>
EVL as a function of the window size per
stream. |
| . |
|
Throughput per stream for two host pairs in the
direction EVL =>
WCW 1 & 2 as a function of
the window size per stream. |
Conclusions
Due to the analogous topology the results from the
, ...,
can be compared with the results
before the memory upgrade, that are presented in the
figures 1,
2,
5
and 6. This comparison
leads to the following conclusions:
-
The maximum throughput in the direction WCW => EVL
is after the memory upgrade lower than before, while in the reverse
direction the maximum throughput is higher than before, while in the reverse
direction the maximum throughput after the upgrade is higher. This behaviour
might be caused by an increased difference in host performances after the
memory upgrade.
-
However, when the maximum throughput values are compared for single host
streams, the performance after memory upgrading is better for the direction
WCW => EVL and worse for the reverse direction.
Different window sampling in both situations may play a role: the line slope
in the graphs of the throughput per stream as function of the TCP
window size per stream is considerable.
-
Comparable conclusion as in the
"Conclusions"
subsection of the
"VLAN WCW 1 <=> VLAN EVL" section can be drawn.
VLAN WCW 1 <=> VLAN WCW 2
Setup
In this section the results are presented from throughput tests between two
SARA hosts, i.e.
gwgsara2, located in VLAN WCW 1 and
gwgsara4, located in VLAN WCW 2. This
implies that the traffic between these two hosts and VLAN's is following the
path Amsterdam - Chicago - Amsterdam. Again
the maximum TCP window and socket sizes per host were 16 Mbyte and
the test duration was 60 seconds.
Results
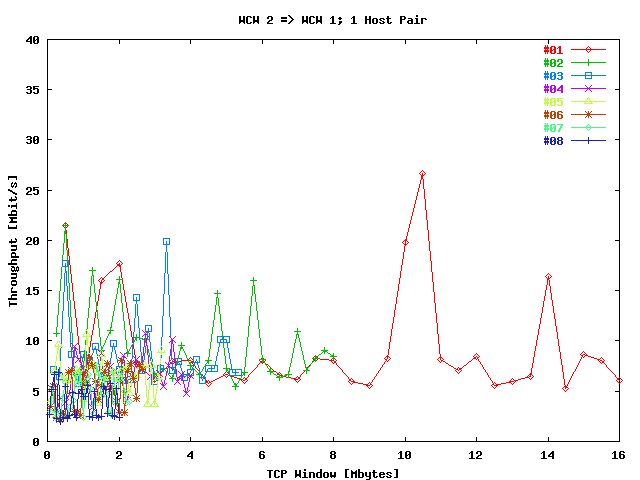
In
the sum of the TCP throughput has been presented as a function of the sum over
the TCP window size and the total # streams.
displays these data for the reverse direction.
| . |
|
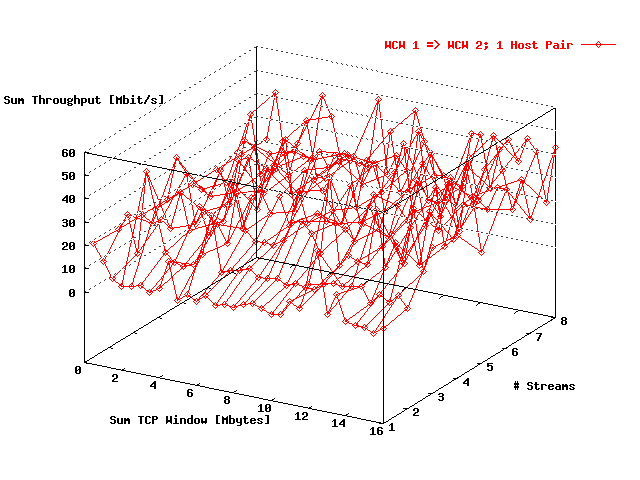
Sum throughput for one host pair in the direction
WCW 1 => WCW 2 as
a function of the total window size and the
# streams. |
| . |
|
Sum throughput for one host pair in the direction
WCW 2 => WCW 1 as
a function of the total window size and the
# streams. |
gives the mean throughput per stream as function of the TCP window size
for the direction WCW 1 => WCW 2. In
these data are displayed for the reverse direction.
| . |
|
Throughput per stream for one host pair in the
direction WCW 1 =>
WCW 2 as a function of the window size per
stream. |
| . |
|
Throughput per stream for one host pair in the
direction WCW 2 =>
WCW 1 as a function of the window size per
stream. |
Conclusions
Because hosts were being upgrade to Linux 2.4 at that moment, only hosts
gwgsara2 and gwgsara4
were available for these tests, so that only one host pair could be used.
Unfortunately that makes the comparison with the
results before the update difficult, because from
those tests only results with two host pairs were available.
But also in these tests presented by the
, ...,
the bad performance at the route Amsterdam - Chicago - Amsterdam has
been observed again. We do not have a good explanation for this poor
performance.
UDP Tests
For the UDP bandwidth tests the same topology and tools has been used
as described in the "TCP Tests" section.
The details of the UDP tests are described in the following sections.
Also for these tests Iperf
was used.
VLAN's WCW 1 & 2 <=> VLAN EVL
Setup
In this setup UDP bandwidth tests were performed from the
SARA hosts
gwgsara2 in VLAN WCW 1 and
gwgsara4 in VLAN WCW 2 to the
EVL hosts
prusin and reynolds,
both situated in the same VLAN. Also measurements in the reverse direction were
performed. All tests were executed with two host pairs. The sum of the bandwidth
to be send over the streams was maximal 1500 Mbit/s. The duration of each
test was 60 s.
Results
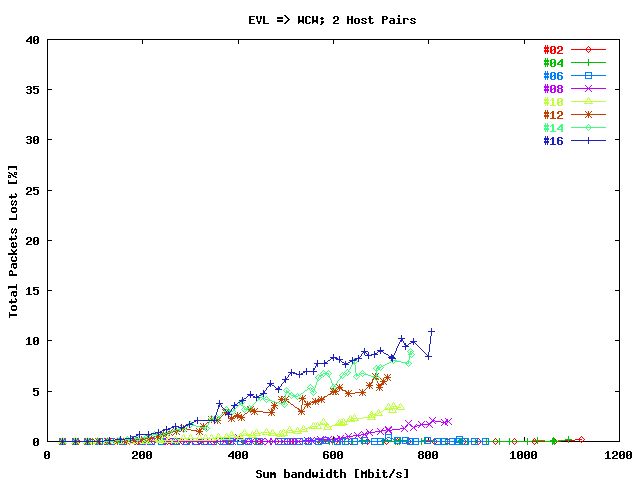
displays the percentage total packets lost as a function of the total bandwidth
send in the direction WCW 1 & 2 =>
EVL. In
the results for the reverse direction are presented. In both figures the data
valid for a particular # streams are represented by a separate plot trace.
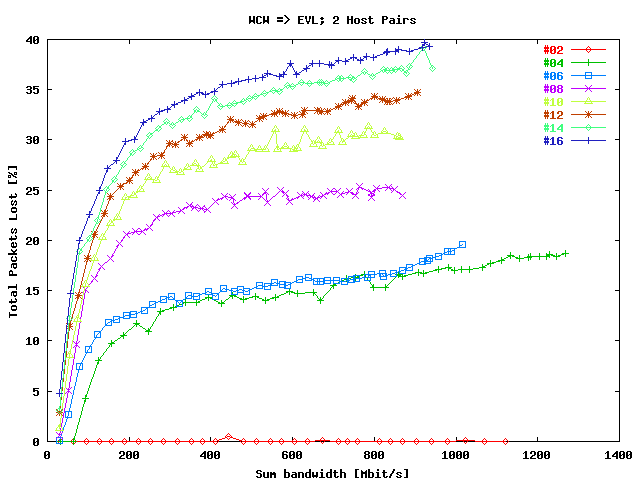
| . |
|
Total packets lost for two host pairs in the direction
WCW 1 & 2 =>
EVL as a function of the sum of the
bandwidths. |
| . |
|
Total packets lost for two host pairs in the direction
EVL =>
WCW 1 & 2 as a function of
the sum of the bandwidths. |
Conclusions
Comparison with the UDP bandwidth results
before the memory results, described there in the
corresponding "Setup"
section is not well possible, because at the time the UDP tests were
executed no three hosts with 512 Mbyte memory were not yet available to do
the tests as described in that document.
But from the
there can be concluded:
-
The observed bandwidths without packets lost seem to be limited by the
hosts, not the Cisco ONS.
-
The better performance in the direction EVL =>
WCW 1 & 2 can be understood by the better
performance of the WCW hosts.
^^ Before ONS Upgrade |
^ Before Memory Upgrade |
v After Linux Upgrade