Lambda TCP / UDP Measurements after Upgrade of the ONS
In this document some results are presented obtained with TCP and
UDP measurements at the Lambda between
SURFnet, Amsterdam, and
StarLight, Chicago, as part of
the
Netherlight project. The results displayed here are obtained after the
upgrade of the ONS. See the also the
results before the upgrade.
The tests were executed between the following hosts:
TCP Tests
Setup
The following throughput tests were performed:
-
From the two hosts at EVL to
two hosts at SARA, where each host was
located in a different VLAN.
-
From the two hosts at VLAN WCW 1 to the two hosts at VLAN WCW 2,
and reversely. The followed route was here Amsterdam - Chicago -
Amsterdam.
At each host one to eight streams were started to the equivalent host at the
other location. During these test the sum of the TCP window sizes over
the streams was maximal 8 Mbyte. The duration of each test was 180 s.
The TCP streams were generated using
Iperf, because this tool can
easily handle multiple streams. A special script has been used to start the
streams at both source hosts more or less at the same time, using the remote
secure shell mechanism.
Results
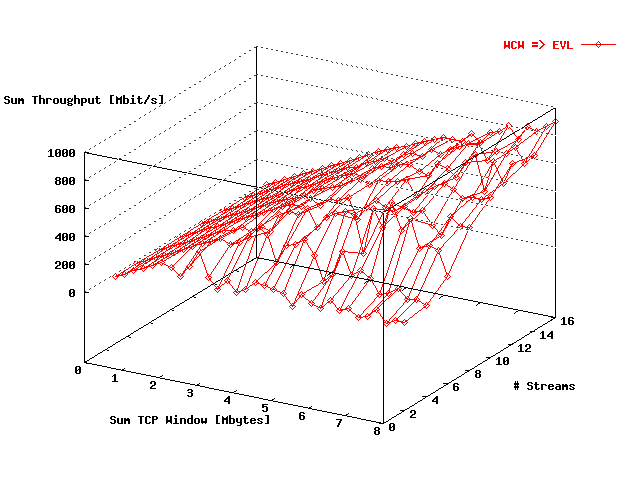
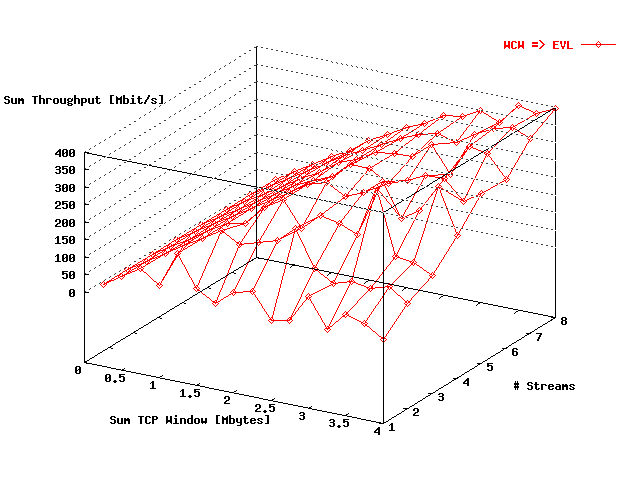
In the figures, displayed below, the sum of the TCP throughput values
over all streams is presented as a function of the sum of the
TCP window sizes taken over all source hosts (the destination window
sizes are identical) and as a function of the total # streams.
displays in a 3D figure the throughput as a function of the total window
size and the # streams in the direction WCW =>
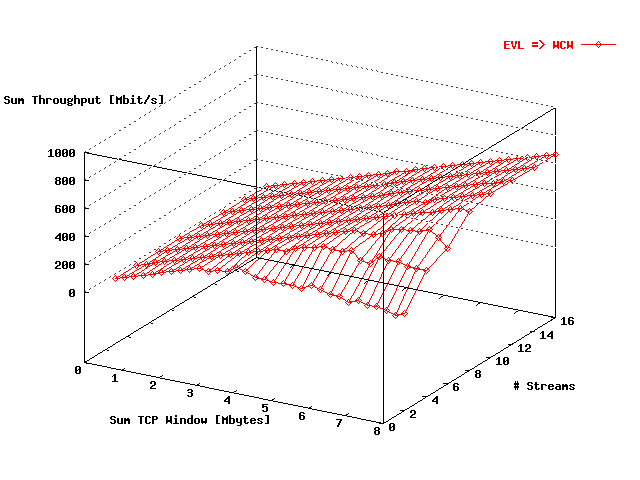
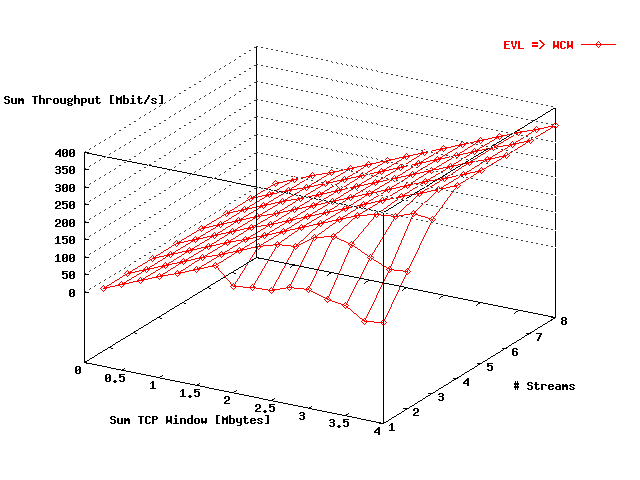
EVL. In
these data are presented for the reverse direction.
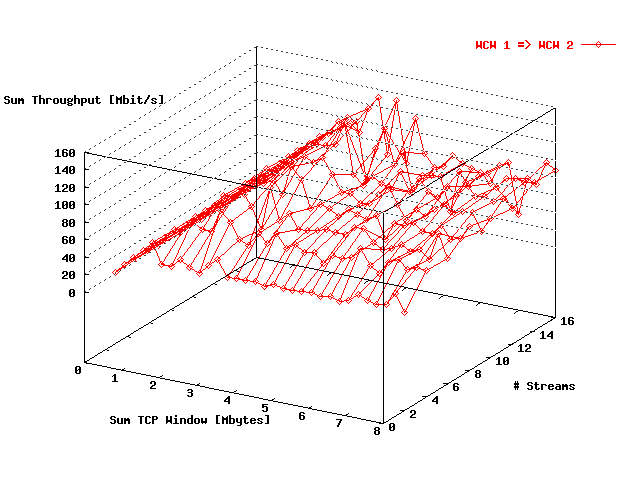
displays these data from VLAN WCW 1 to WCW 2.
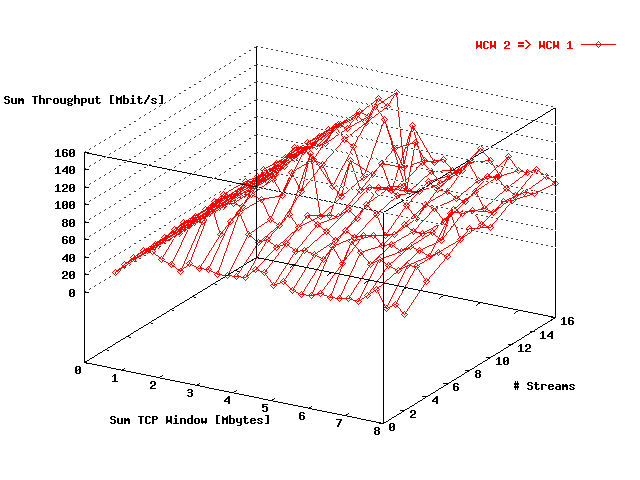
shows the reverse direction.
| . |
|
Sum throughput WCW => EVL as
function of the total window size and the
# streams. |
| . |
|
Sum throughput EVL => WCW as
function of the total window size and the
# streams. |
| . |
|
Sum throughput WCW 1 =>
WCW 2 as function of the total window size
and the # streams. |
| . |
|
Sum throughput WCW 2 =>
WCW 1 as function of the total window size
and the # streams. |
From
figures
to
the following conclusions can be drawn:
-
The throughput performance for the streams in the direction
WCW => EVL
()
is somewhat better as in the
reverse direction
().
That may be caused by host dependent effects.
-
From the
figures
and
there follows that the throughput between both WCW VLAN's is much
lower than between WCW and EVL, also when there has been
taken into account that both VLAN's are shared at the WCW tests. In fact the
performance is much worse compared with the situation before the upgrade.
Also host effects may play a role here.
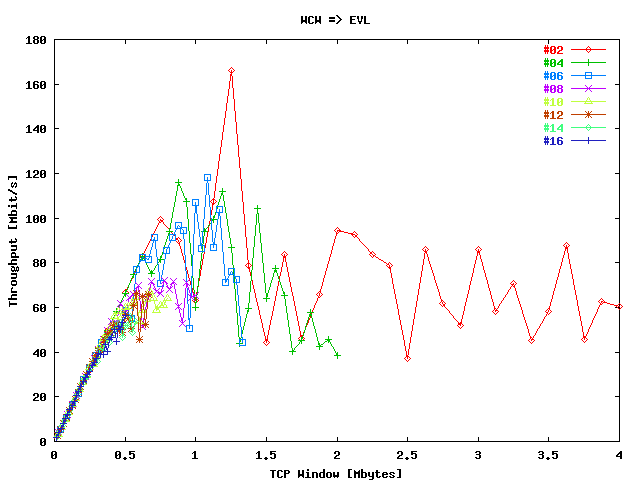
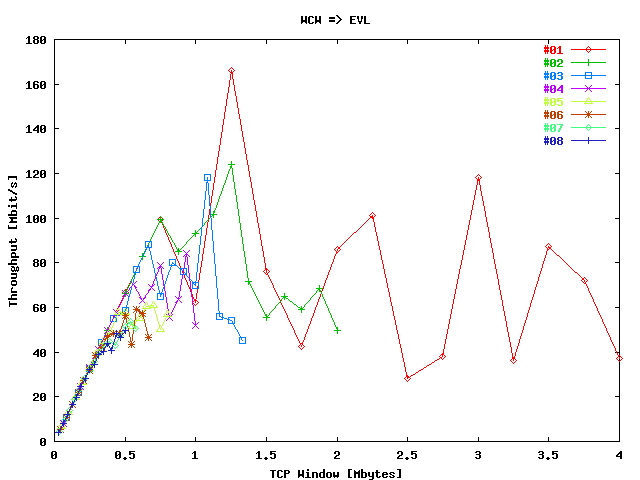
In
the mean throughput per stream has been given as function of the TCP
window size per stream in the direction WCW => EVL.
Each # streams is represented in this plot by a trace.
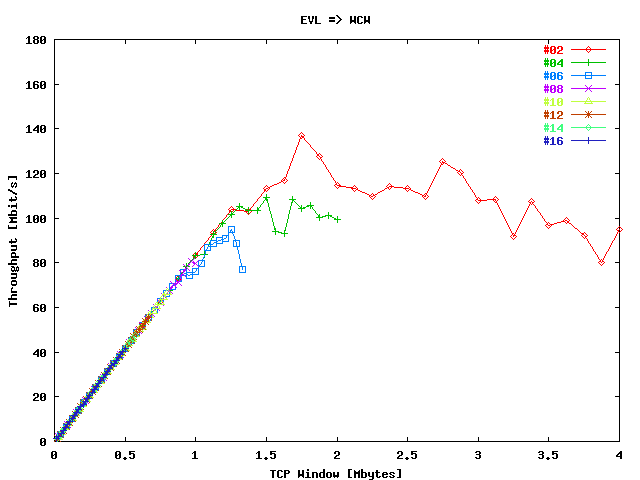
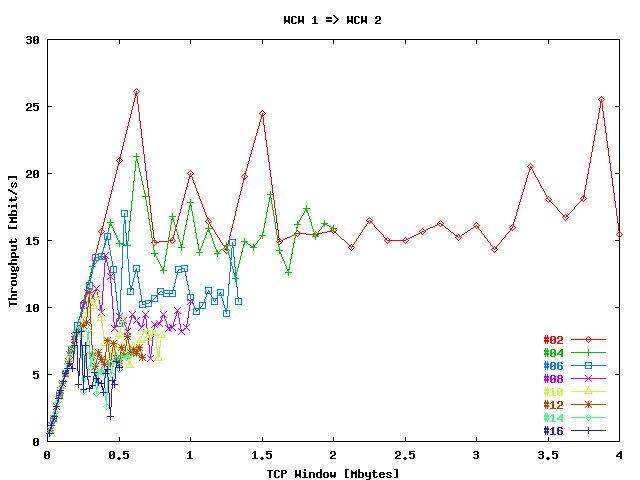
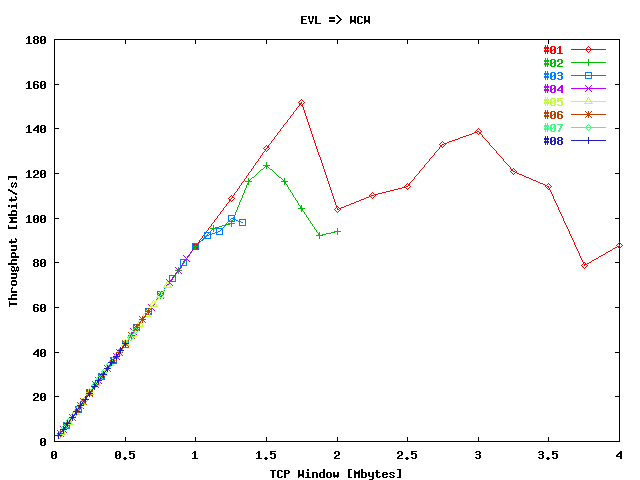
displays these results for the reverse direction. In
corresponding results are presented for the direction VLAN
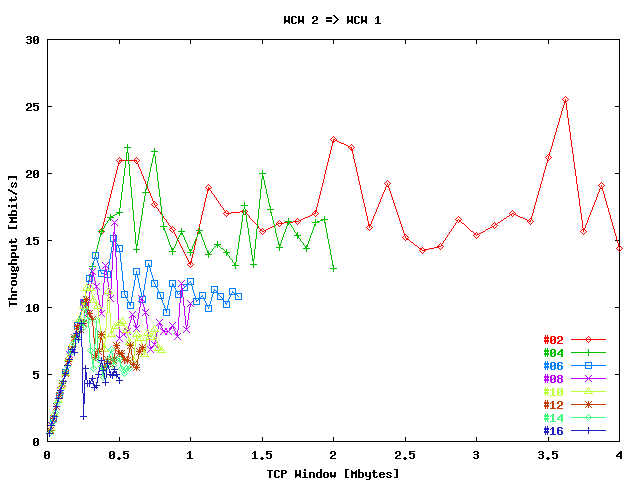
WCW 1 => VLAN WCW 2 and in
for the reverse direction.
| . |
|
Throughput per stream in the direction
WCW => EVL as function of the
window size per stream. |
| . |
|
Throughput per stream in the direction
EVL => WCW as function of the
window size per stream. |
| . |
|
Throughput per stream in the direction
WCW 1 => WCW 2 as
function of the window size per stream. |
| . |
|
Throughput per stream in the direction
WCW 2 => WCW 1 as
function of the window size per stream. |
From
figures
to
about the same conclusions can be drawn as from the
figures
to .
From these figures it is also clear that with and increase of the # streams
the performance per stream is becoming better, as can be expected.
TCP Tests without SSR
Setup
In this section the TCP throughput tests from the
"TCP Tests" section were repeated with a
single host pair, where the SSR 8000 at
SARA was not used anymore.
Host gwgsara4 was directly connected with the
Cisco ONS. At the
EVL site
host reynolds have been used. During the single
host pair tests the sum of the TCP window sizes over the streams was
maximal 4 Mbyte. Also here the duration of each test was maximal
180 s.
Results
As in the "TCP Tests" section, the sum
of the TCP throughput values is presented as a function of the
TCP window sizes and the total # streams in the form of
3D figures. In
this has been done for the direction WCW => EVL and in
for the reverse direction.
| . |
|
Sum throughput WCW => EVL as
function of the total window size and the
# streams for a single host pair without using the
SSR. |
| . |
|
Sum throughput EVL => WCW as
function of the total window size and the
# streams for a single host pair without using the
SSR. |
From the single host pair
figures
and
there follows that the observed throughput is about the half of the tests with
two host pairs
(figures
and ).
In
the corresponding mean throughput per stream has been given as a function of the
TCP window size per stream for the direction WCW =>
EVL. In
these data are presented for the reverse direction.
| . |
|
Throughput per stream in the direction
WCW => EVL as
function of the window size per stream for a single host
pair without using the SSR. |
| . |
|
Throughput per stream in the direction
EVL => WCW as
function of the window size per stream for a single host
pair without using the SSR. |
In general there can be concluded that the SSR 8000 does not have much
influence at the results.
FreeBSD TCP Tests over the Loop-back Interface
Setup
In this section TCP throughput tests were performed between two hosts
located at the NIKHEF, Amsterdam. Both are
directly connected to the Amsterdam Cisco ONS. At Chicago the
loop-back interface has been used. The following hosts were used:
At each host one to eight streams were started to the equivalent host at the
other location. During these tests the sum of the TCP window sizes over
the streams was maximal 4 Mbyte. The duration of each test was maximal
60 s. Because the pthread library did not work properly under
FreeBSD, multiple processes of
Netperf has been
used here to generate the multiple TCP streams.
Results
The sum of the TCP throughput values is presented as a function of the
TCP window sizes and the total # streams in the following
3D figures. In
this has been done for the direction FreeBSD => Web100
and in
for the reverse direction.
| . |
|
Sum throughput FreeBSD =>
Web100 as function of the total window size and
the # streams for a single host pair using the
loop-back interface. |
| . |
|
Sum throughput Web100 =>
FreeBSD as function of the total window size
and the # streams for a single host pair using the
loop-back interface. |
In
the corresponding mean throughput per stream has been given as a function of the
TCP window size per stream for the direction
FreeBSD => Web100. In
these data are presented for the reverse direction.
| . |
|
Sum throughput FreeBSD =>
Web100 as function of the window size per
stream for a single host pair using the loop-back
interface. |
| . |
|
Sum throughput Web100 =>
FreeBSD as function of the window size per
stream for a single host pair using the loop-back
interface. |
When these results are compared with the the tests between the two WCW
VLAN's than it appears that the throughput at higher TCP window sizes
is significantly higher at these tests between the FreeBSD and
Web100 hosts.
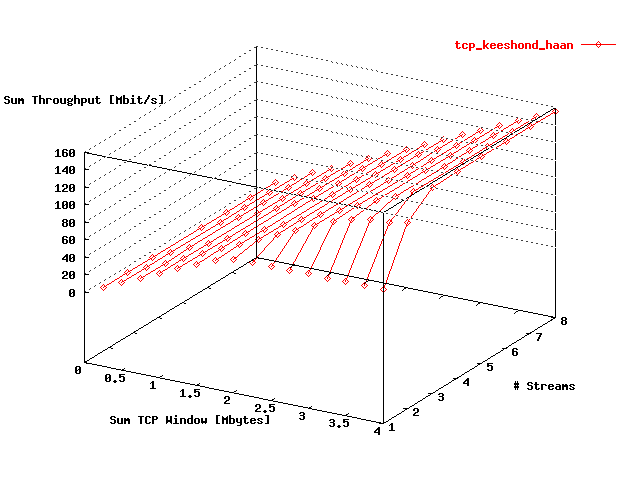
Jumbo Frame TCP Tests over the Loop-back Interface
Setup
As in section
"FreeBSD TCP Tests over the Loop-back Interface" the same
NIKHEF hosts were used, but here the OS from
host keeshond was Linux 2.4. Also were Jumbo
frames enabled: a MTU of 9000 bytes was used. Also at these tests
Netperf has been
used to generate the multiple TCP streams.
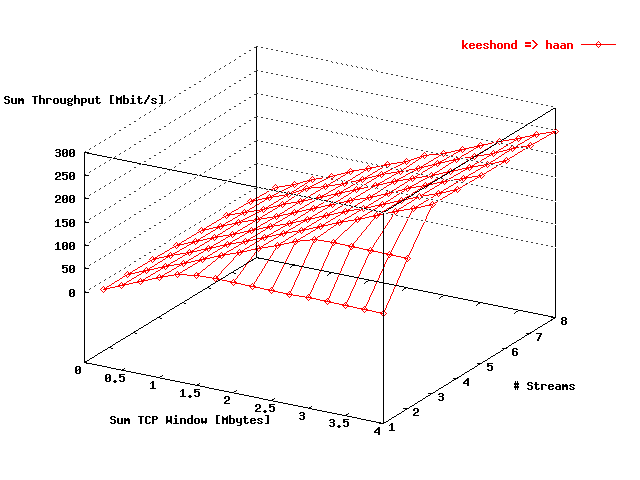
The sum of the TCP throughput values is presented as a function of the
TCP window sizes and the total # streams in the following
3D figures. In
this has been done for the direction Linux => Web100
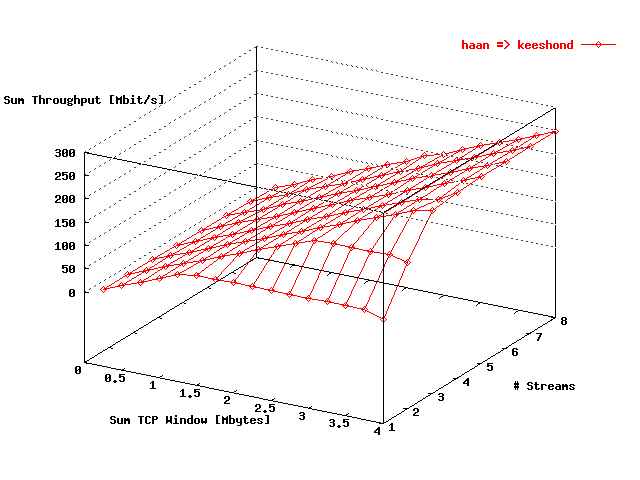
and in
for the reverse direction.
| . |
|
Sum throughput Limux =>
Web100 as function of the total window size and
the # streams for a single host pair using the
loop-back interface with a MTU of
9000 bytes. |
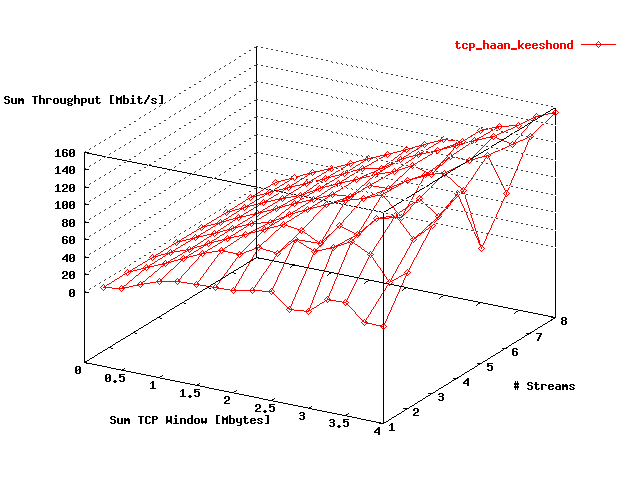
| . |
|
Sum throughput Web100 =>
Linux as function of the total window size
and the # streams for a single host pair using the
loop-back interface with a MTU of
9000 bytes. |
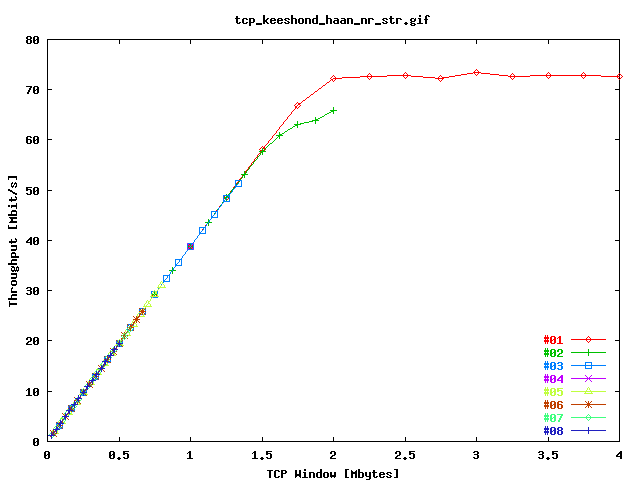
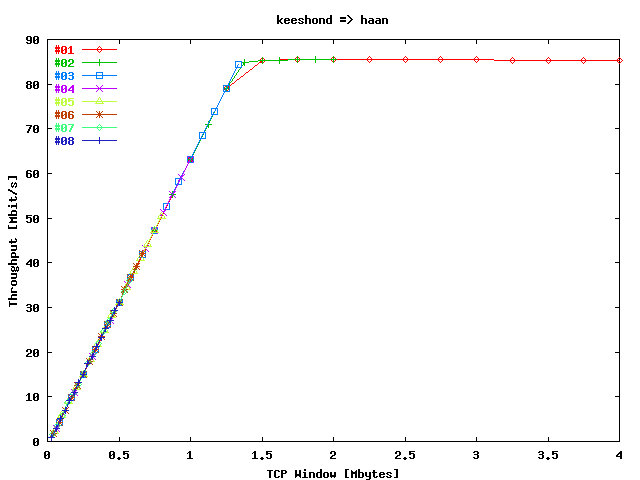
In
the corresponding mean throughput per stream has been given as a function of the
TCP window size per stream for the direction
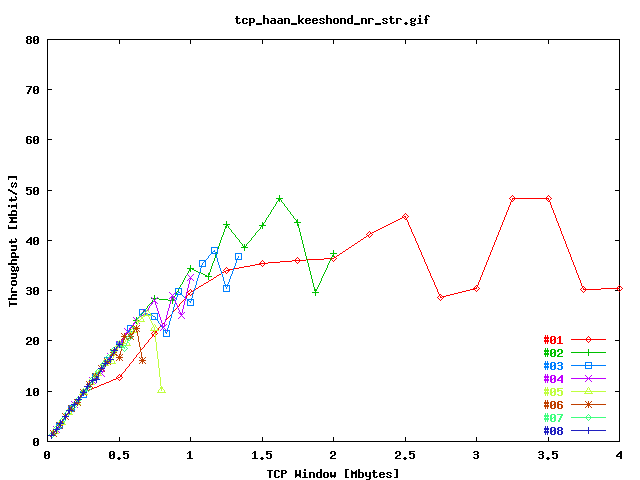
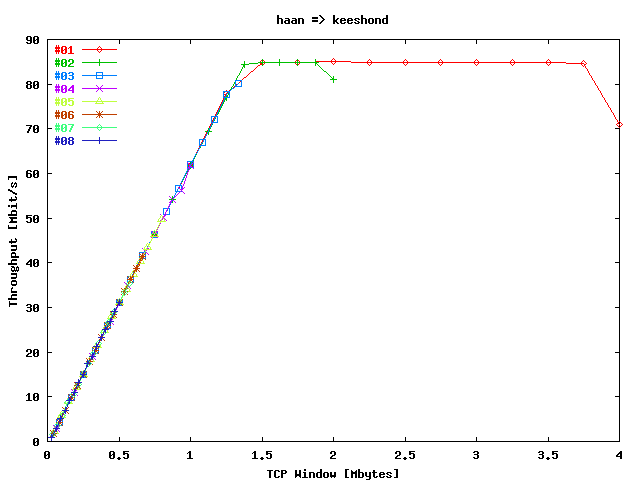
Linux => Web100. In
these data are presented for the reverse direction.
| . |
|
Sum throughput Linux =>
Web100 as function of the window size per
stream for a single host pair using the loop-back
interface with a MTU of
9000 bytes. |
| . |
|
Sum throughput Web100 =>
Linux as function of the window size per stream
for a single host pair using the loop-back interface
with a MTU of 9000 bytes. |
From these figures there follows that larger packet sizes are leading to higher
TCP throughput values, indicating that the # packets send are the
limiting factors. Presumably these are hosts effects.
UDP Tests
Setup
To become a load as hight as possible, concerning the host topology,
UDP bandwidth tests were performed with the following three streams:
At each source host one to eight streams were started to the equivalent
destination host. During these tests the sum of the bandwidth send over
the streams was maximal 1500 Mbit/s. The duration of each test was
180 s. The streams were generated with
Iperf.
Results
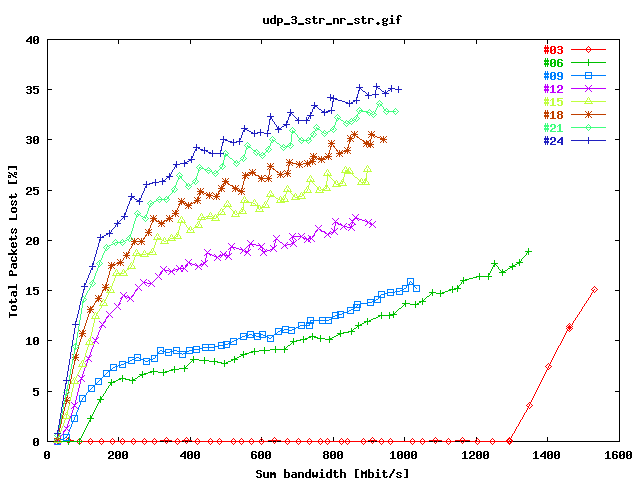
displays the percentage total packets lost as a function of the total bandwidth
send for the three streams described in the
"Setup" section. The data obtained for
the selected # streams per host pair are presented by separate plot traces.
| . |
|
Total packets lost for the three streams described in
the "Setup"
section as function of the sum of the
bandwidths. |
From
it follows that the Lambda is good utilised when a single stream for each host
pair is used. Multiple streams per host lead to considerable packets lost. That
may be due to host effects.
Jumbo Frame UDP Tests over the Loop-back Interface
Setup
The same setup has been used as in section
"Jumbo Frame TCP Tests over the Loop-back Interface", but here with
one to eight UDP streams, generated with
Iperf. The test time was
180 ms.
Results
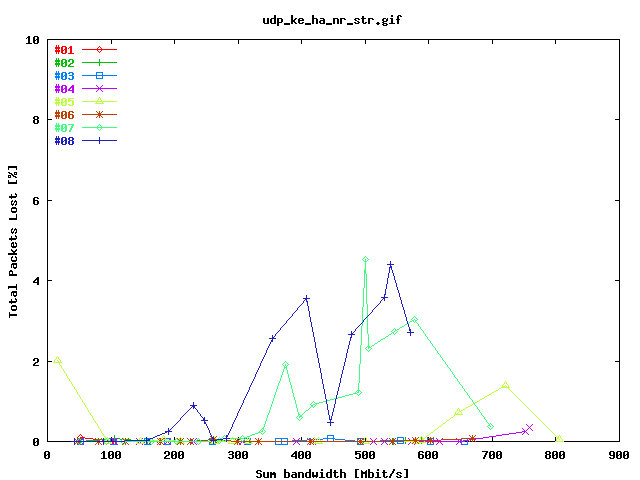
presents the percentages # packets lost as function of the sum bandwidth in
the direction Linux => Web100. In
the results are presented for the reverse direction.
| . |
|
Total packets lost for the stream
Linux => Web100 as function of
the sum of the bandwidths using the loop-back interface
with a MTU of 9000 bytes. |
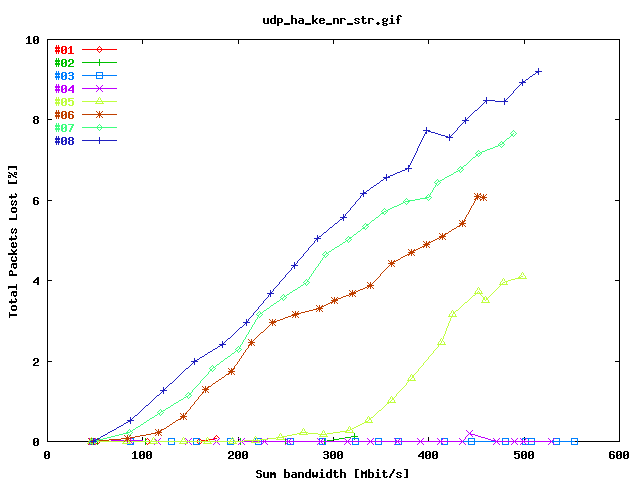
| . |
|
Total packets lost for the stream
Web100 => Linux as function of
the sum of the bandwidths using the loop-back interface
with a MTU of 9000 bytes. |
Also in these tests it is clear that the larger MTU values is leading to
considerable less packets lost, especially for multiple streams.
^ Before ONS Upgrade |
v After Memory Upgrade |
vv After Linux Upgrade