Chapter 2 Personal Information
For the fish that are able the see the stimulus, and either respond or not respond when no other fish responded, we state they have only access to ‘personal information’. The fish that qualify for this, are the first responding fish (FR) and the non-responding fish that see the stimulus in a non-response video (NRL-nr). These two groups are combined into a data set of ‘responders’ (106 fish) and ‘non-responders’ (1375 fish).
2.1 Binary response
2.1.1 Input models
All variable combinations were tested for linear and nonlinear models that describe the input. If ‘Species’ was included, it is fitted as a categorical variable. All other variables are continuous.
For the fish responding to personal information (FR & NRL-nr), the decision function that best predicts the binary response of the individual consists of a linear combination of five variables (see equation below): the species-group (Sc), the relative position to the stimulus (HA), the distance to the center of the stimulus (DCe), the time to collision (TCol) and the group size (GSz). This model has the lowest BIC-value of 535.72 and explains 43% of the variance in the binary response probability (pseudo-R2 = 0.43).
\[ D = \delta_{Sc} - HA - DCe - TCol - GSz \] In this decision function, all variables have a negative influence on the probability of response. For the variable ‘Species’, the categories ‘Bicolor Damselfish’ and ‘Other’ have a lower probability of responding than the ‘Brown Chromis’.
The response probabilities for the best decision function are shown below, along with the observed binary response data coloured by species type, the binned observed response probabilities (black dots) and predicted response probability based on the decision function (orange line). The model seems to predict well for the non-responders, but is less accurate in predicting the responders (the black dots are diverging from the orange line when D is larger).
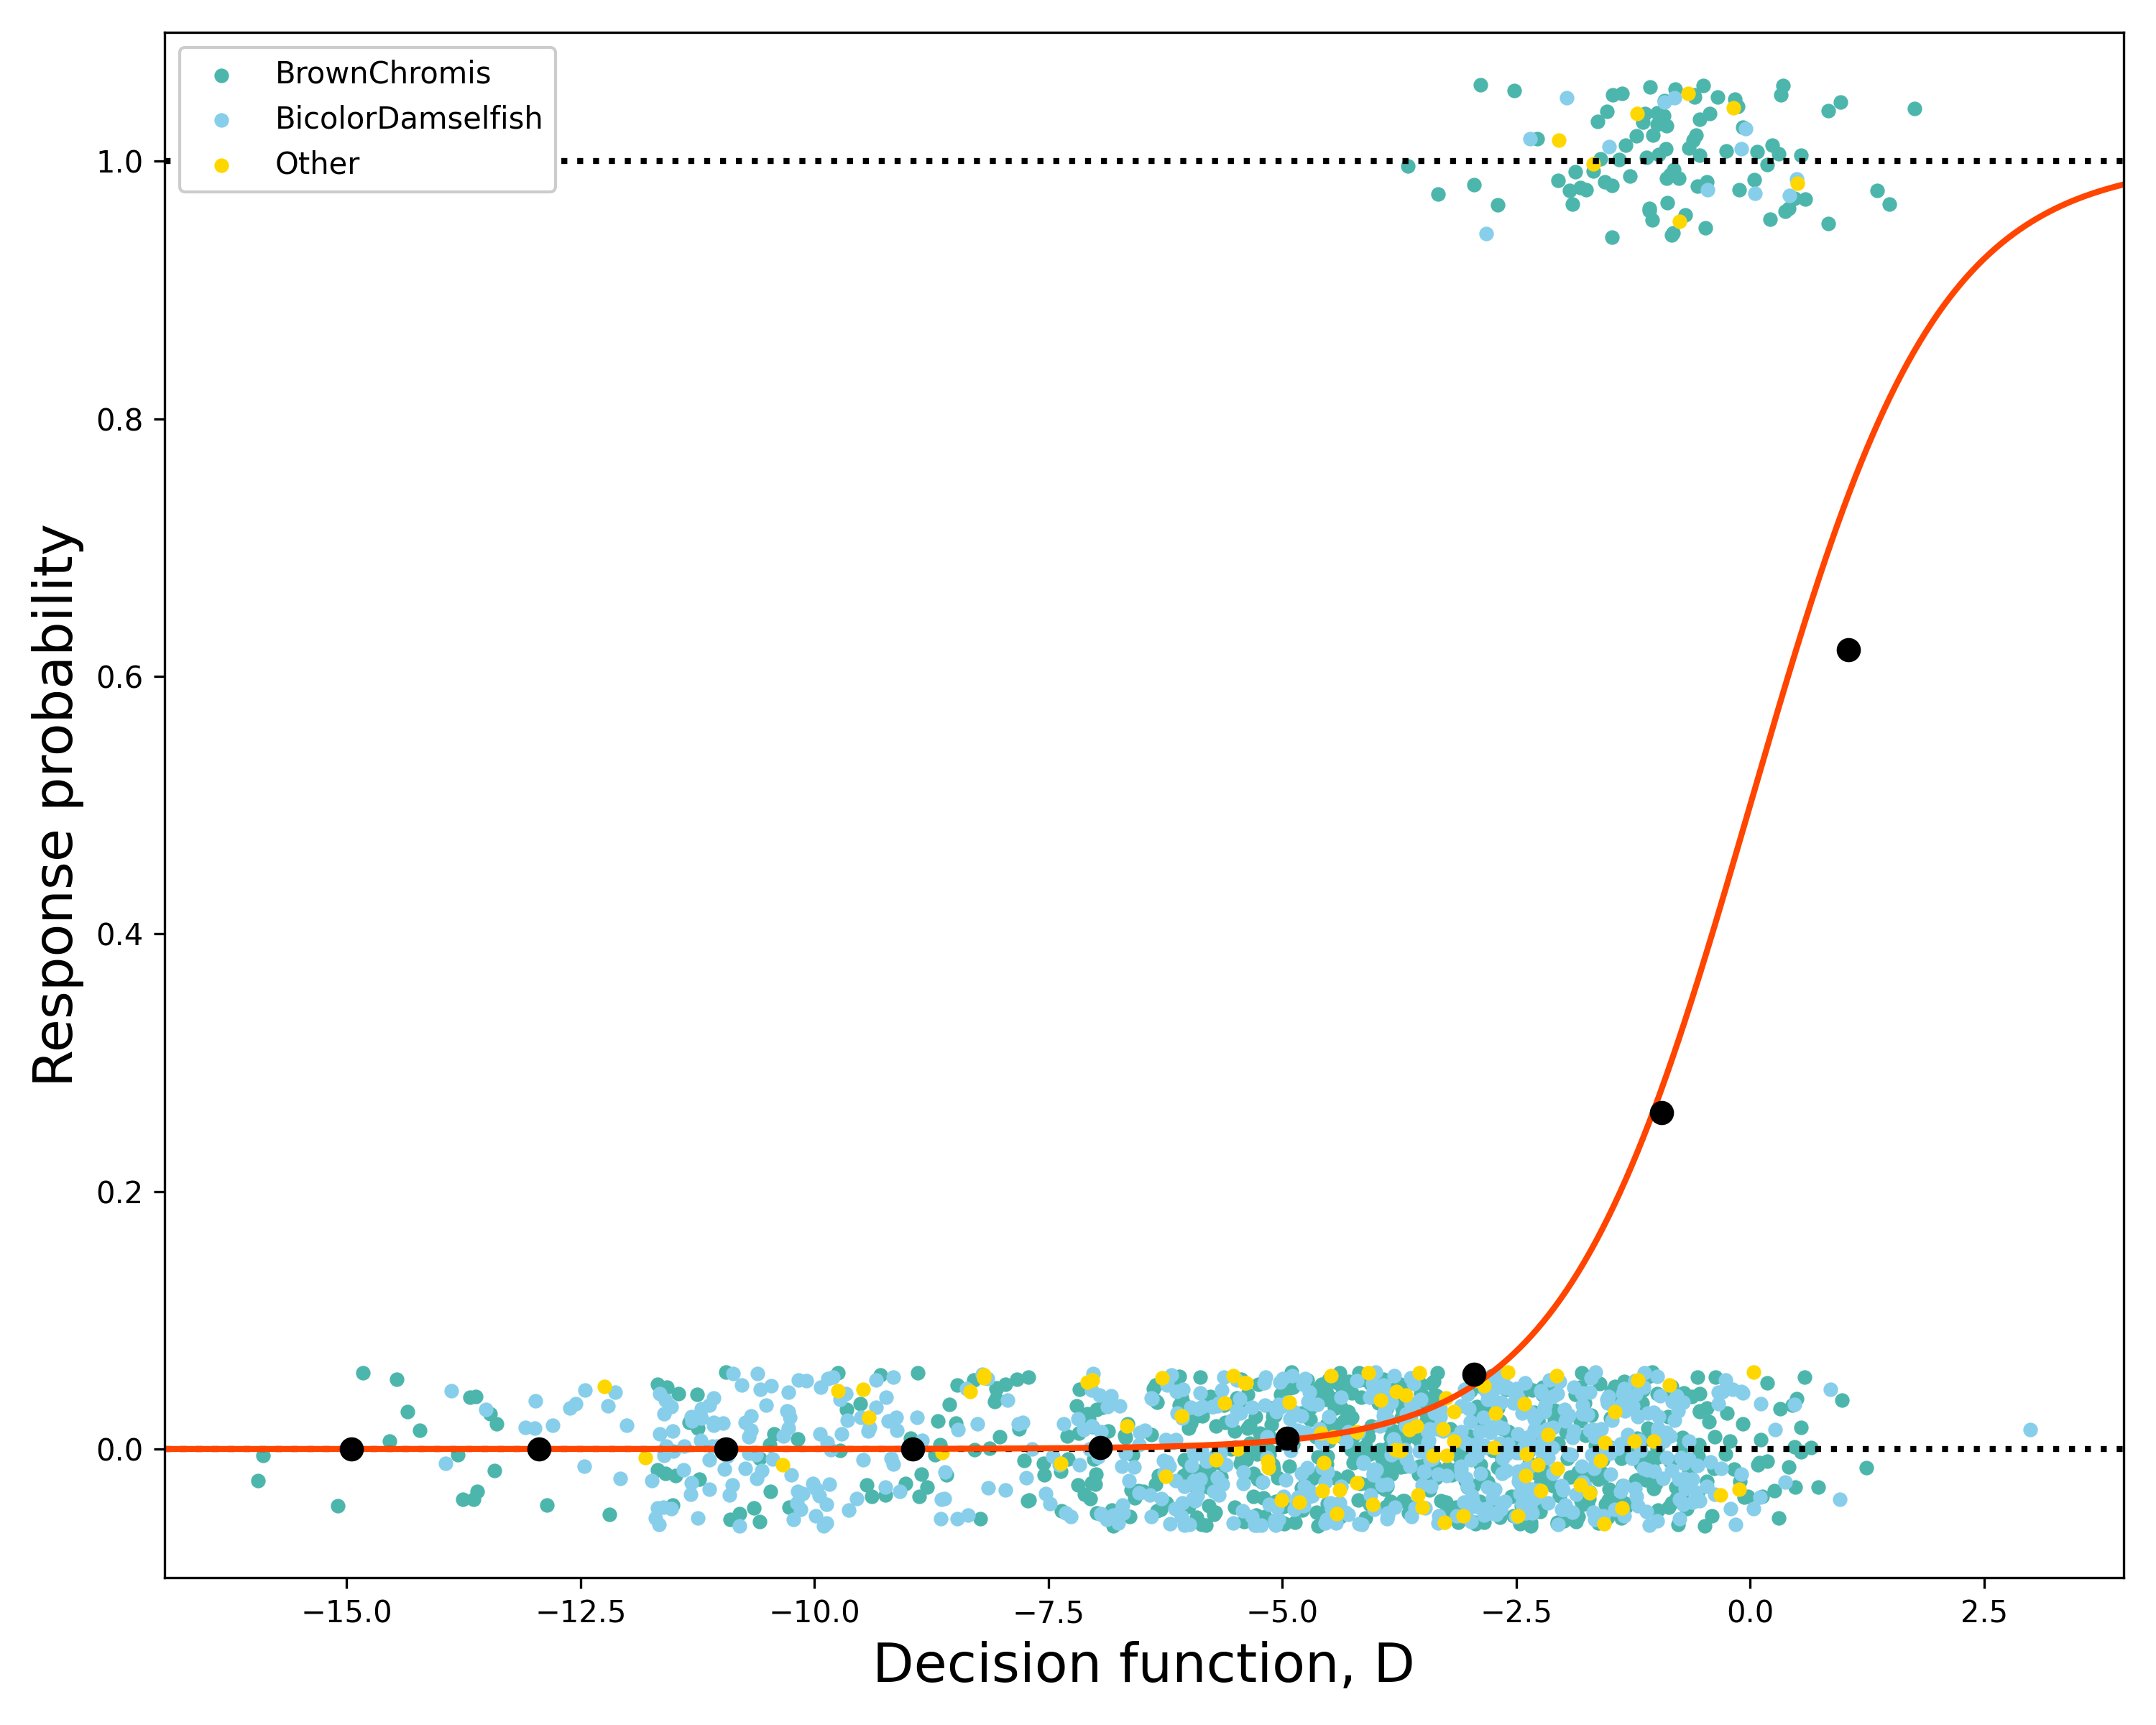
Figure 2.1: Observed binary response data coloured by species type, empirical response probabilities (black points) and predicted response probability based on equation 1 (orange line)
2.1.2 Variable importance
When testing for the variable importance in the dataset including FR and NRL-nr, the Time to Collision comes out as the most important variable, and it seems to be way more important than the other variables.
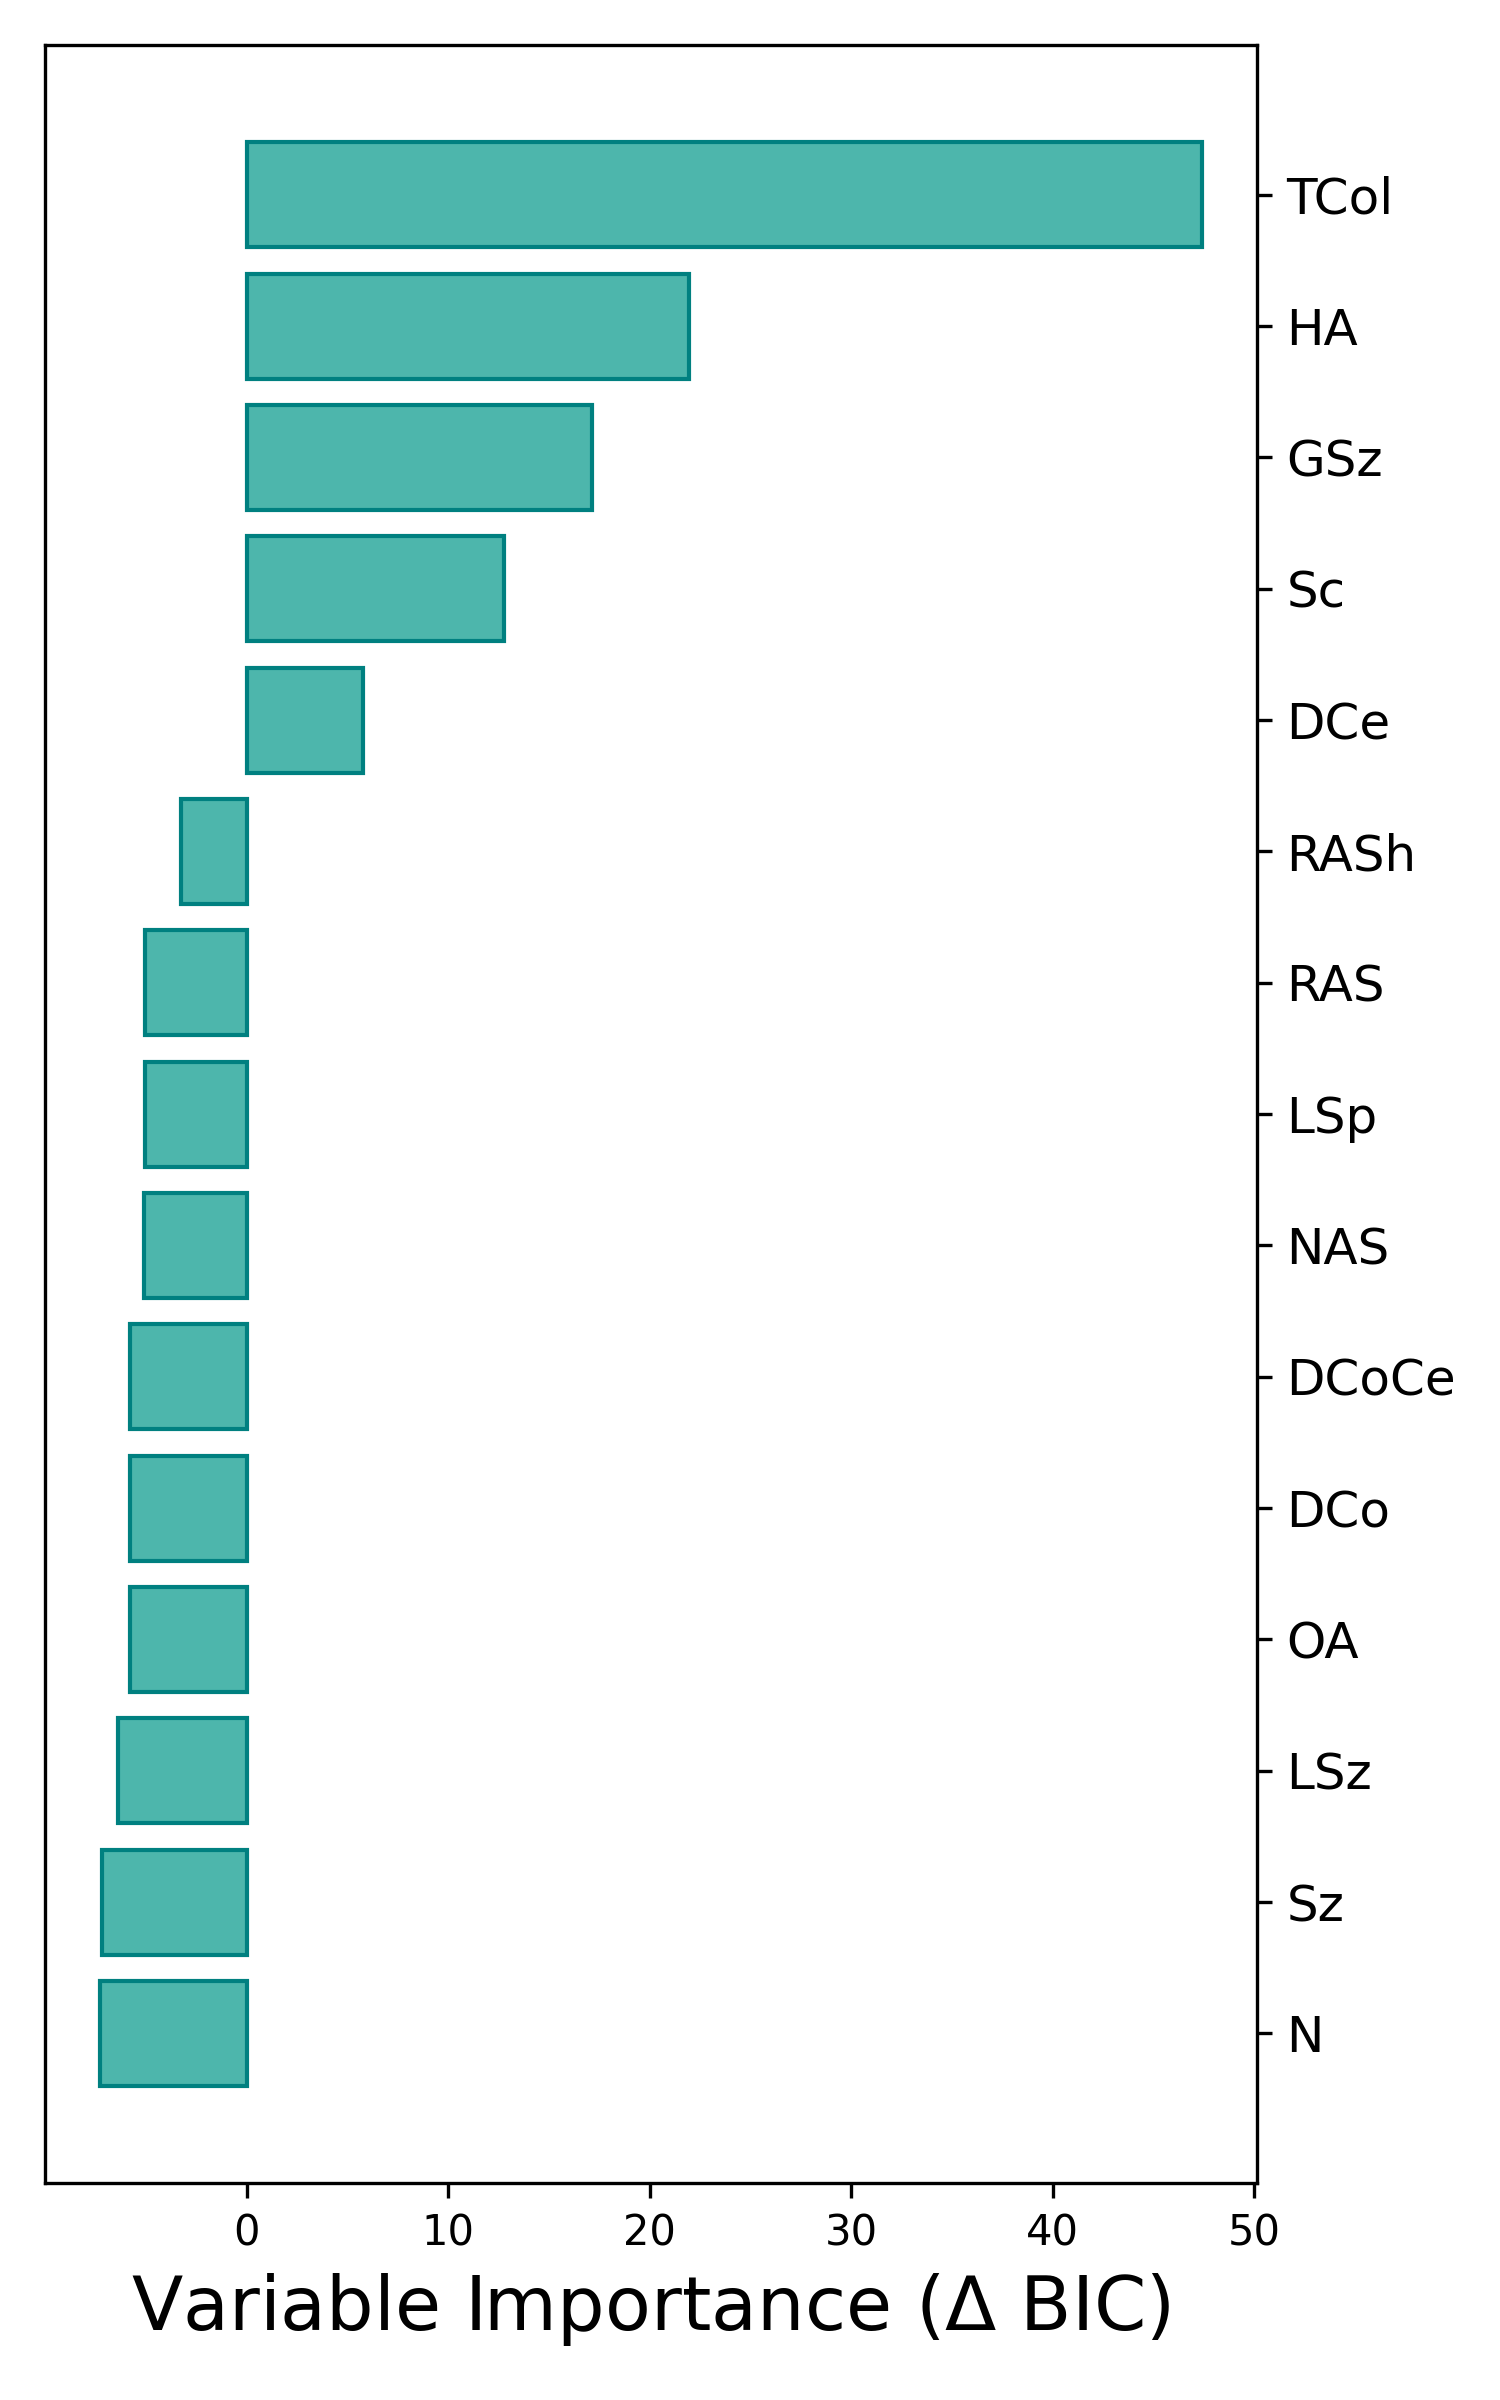
Figure 2.2: Variable importance based on difference in BIC between best model including and excluding the variable
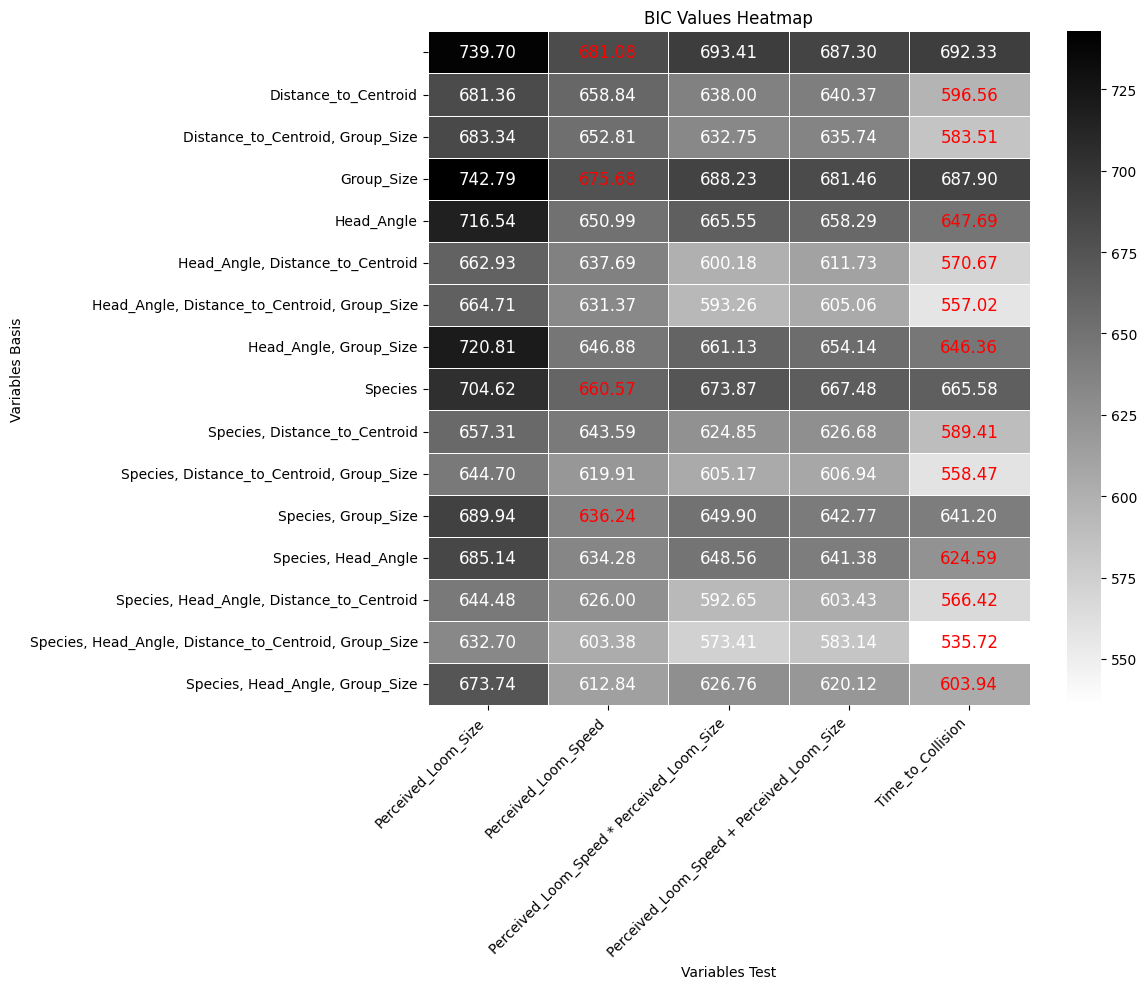
As Time to Collision seems to be so important, I wanted to check what the difference was with models that use Perceived Loom Size, Perceived Loom Speed and a multiplication of that. When no other variables are included, the Perceived Loom Speed has a lower BIC value but for most other combinations with variables, the Time to Collision performs better.