Chapter 3 Combined Information
For the fish that have access to the stimulus, as well as escape responses by neighbours, we state they have access to ‘personal information’ as well as ‘social information’, thus ‘combined information’. The fish that qualify for this are the secondary responders that see the stimulus (SRL) and the non-responders that see the stimulus in a response video (NRL-r). These groups are combined into a data set of ‘responders’ (144 fish) and ‘non-responders’ (340 fish).
The secondary responders can respond to the stimulus or to neighbours that respond, or to a combination of both. Figure 4.1a shows the SRL fish that respond during the stimulus (left of the orange line) and the fish that respond after the stimulus has ended (right of the orange line).
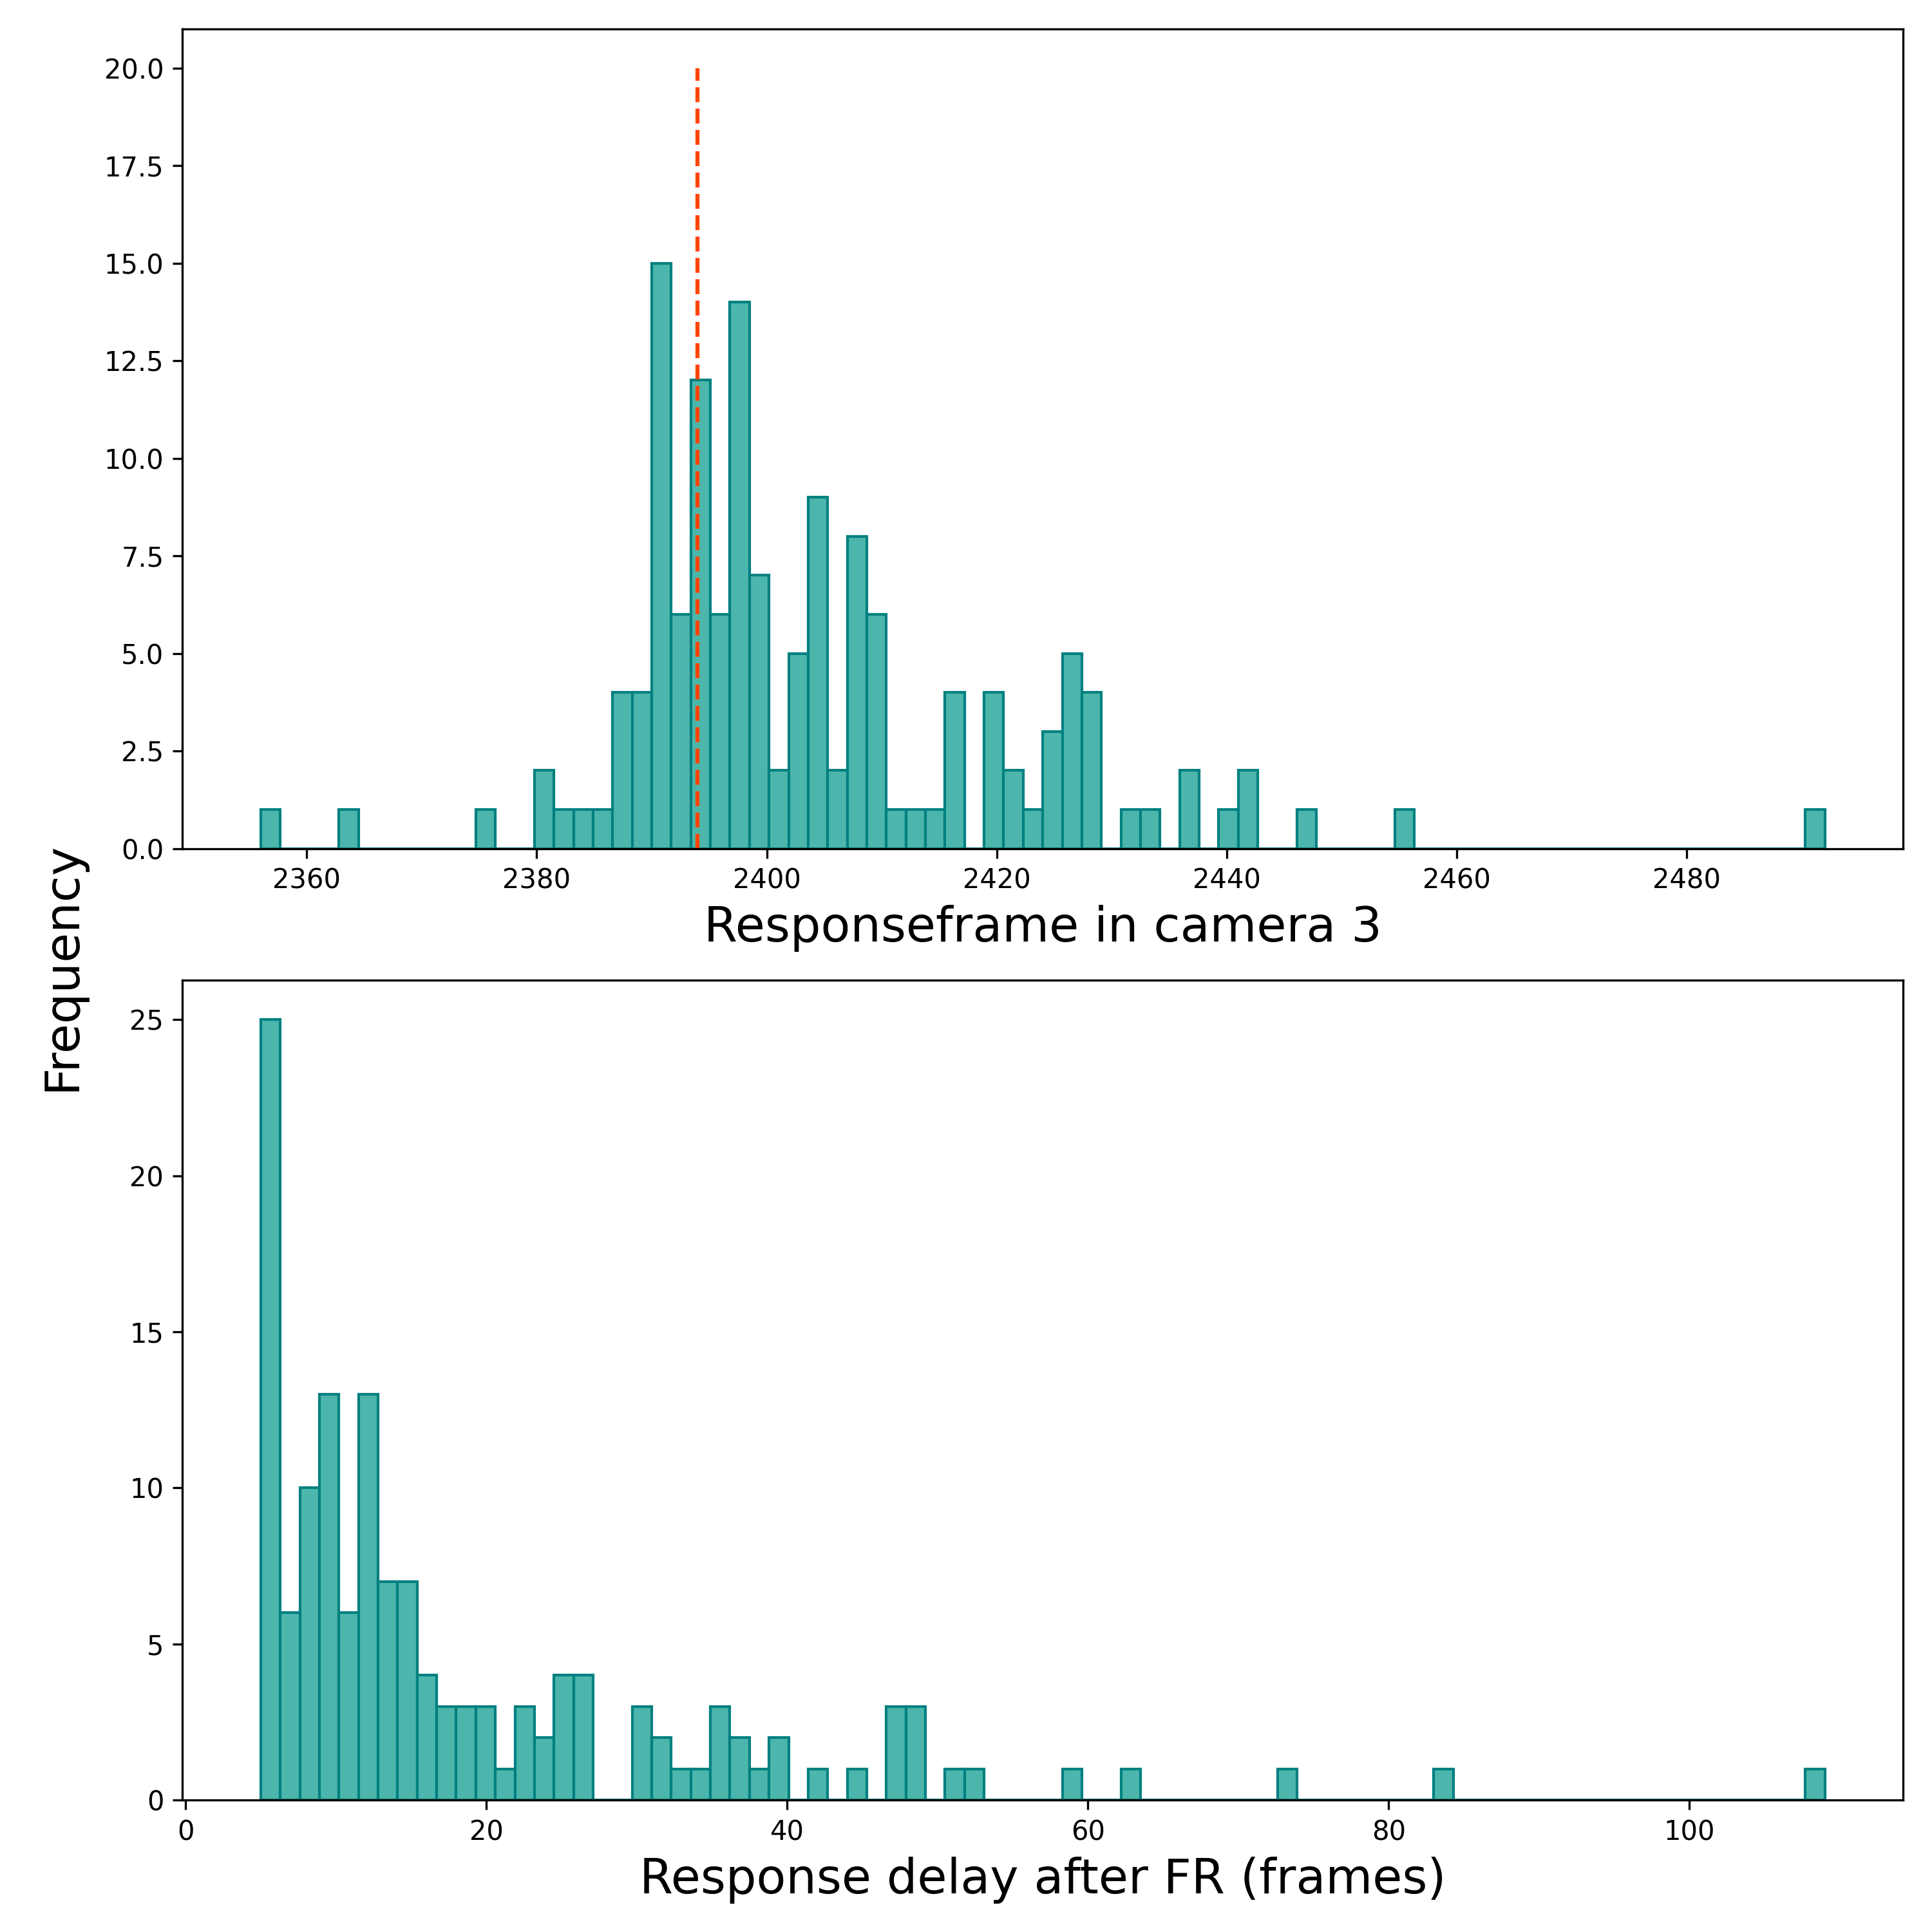
Figure 3.1: Responseframes of SRL fish and end of loom stimulus minus the sensory-motor delay (orange line), and frame after first responder
3.1 Binary response
3.1.1 Input models
This group has more complex information to base their decision on, but to start with, I test the same model set as for the personal responders. The models in this set include social aspects like group size (GSz) and angular size of the neighbours in the individuals visual field (NAS), but all the social information is static; there is no behaviour of the neighbours included in the models yet.
The best fitting model for the decision function that predicts the binary response consists of a linear combination of six variables (see equation below): the distance to the coral (DCo), the perceived speed of the stimulus (LSp), the summed angular size of the neighbours in the visual hemisphere containing the stimulus (N), the ranked angular size of the stimulus in the visual hemisphere it occupies (RAShemi), the time to collision (TCol) and the group size (GSz). The model has the lowest BIC-value of 488.07 and explains 37% of the variance in the binary response probablity (pseudo-R2 = 0.37).
\[ D = \delta + DCo + LSp - N - RAShemi + TCol - GSz \] In this model, the distance to coral, perceived speed of the stimulus and time to collision all have a positive influence on the probability of response. The angular size of neighbours has a negative effect, and the ranked size of the stimulus and the group size as well. The presence of neighbours seems to lower the probability of responding, when not including the behaviour of the neighbours.
In the personal information dataset, the time to collision has a negative effect on the response probability, while in the combined information dataset, this effect has become positive. So when the time to collision increases, the individual is more likely to respond? That does not seem to make sense.
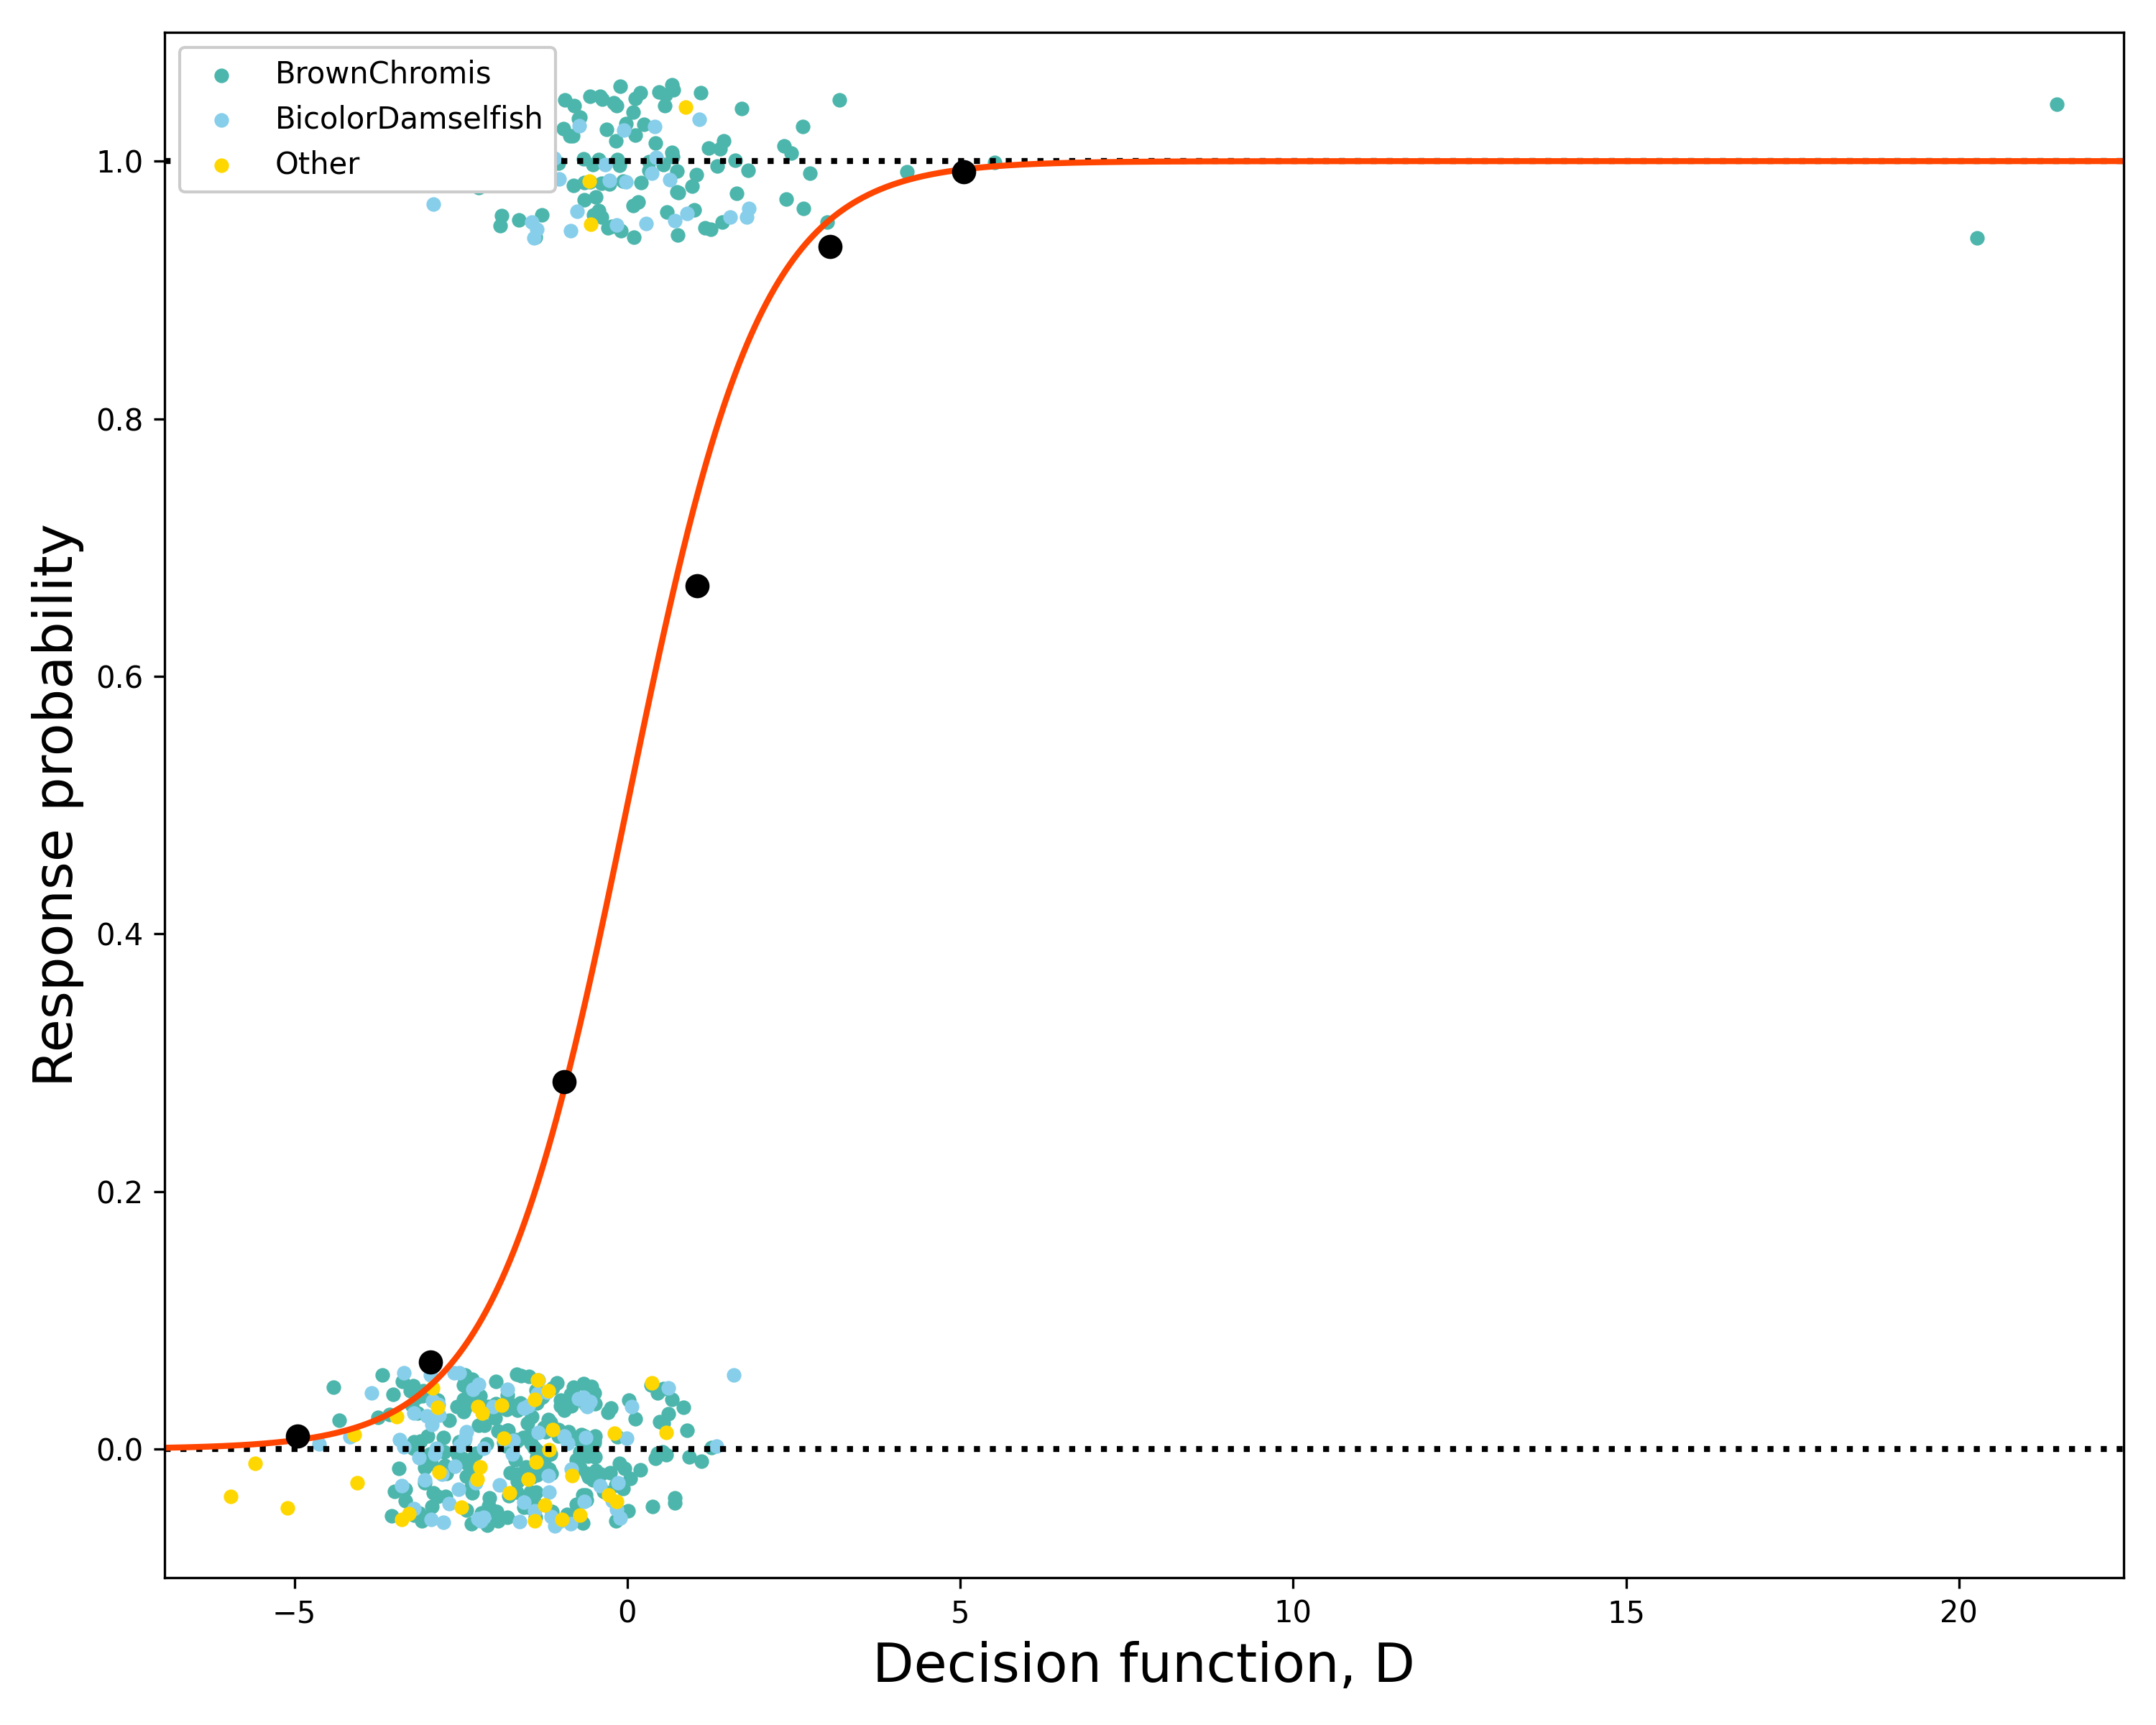
Figure 3.2: Observed binary response data coloured by species type, empirical response probabilities (black points) and predicted response probability based on equation 1 (orange line)
3.1.2 Variable importance
When testing for the variable importance in the dataset including SRL and NRL-r, the group size is the most important variable, followed by the ranked size of the stimulus. The time to collision has become way less important in this dataset.
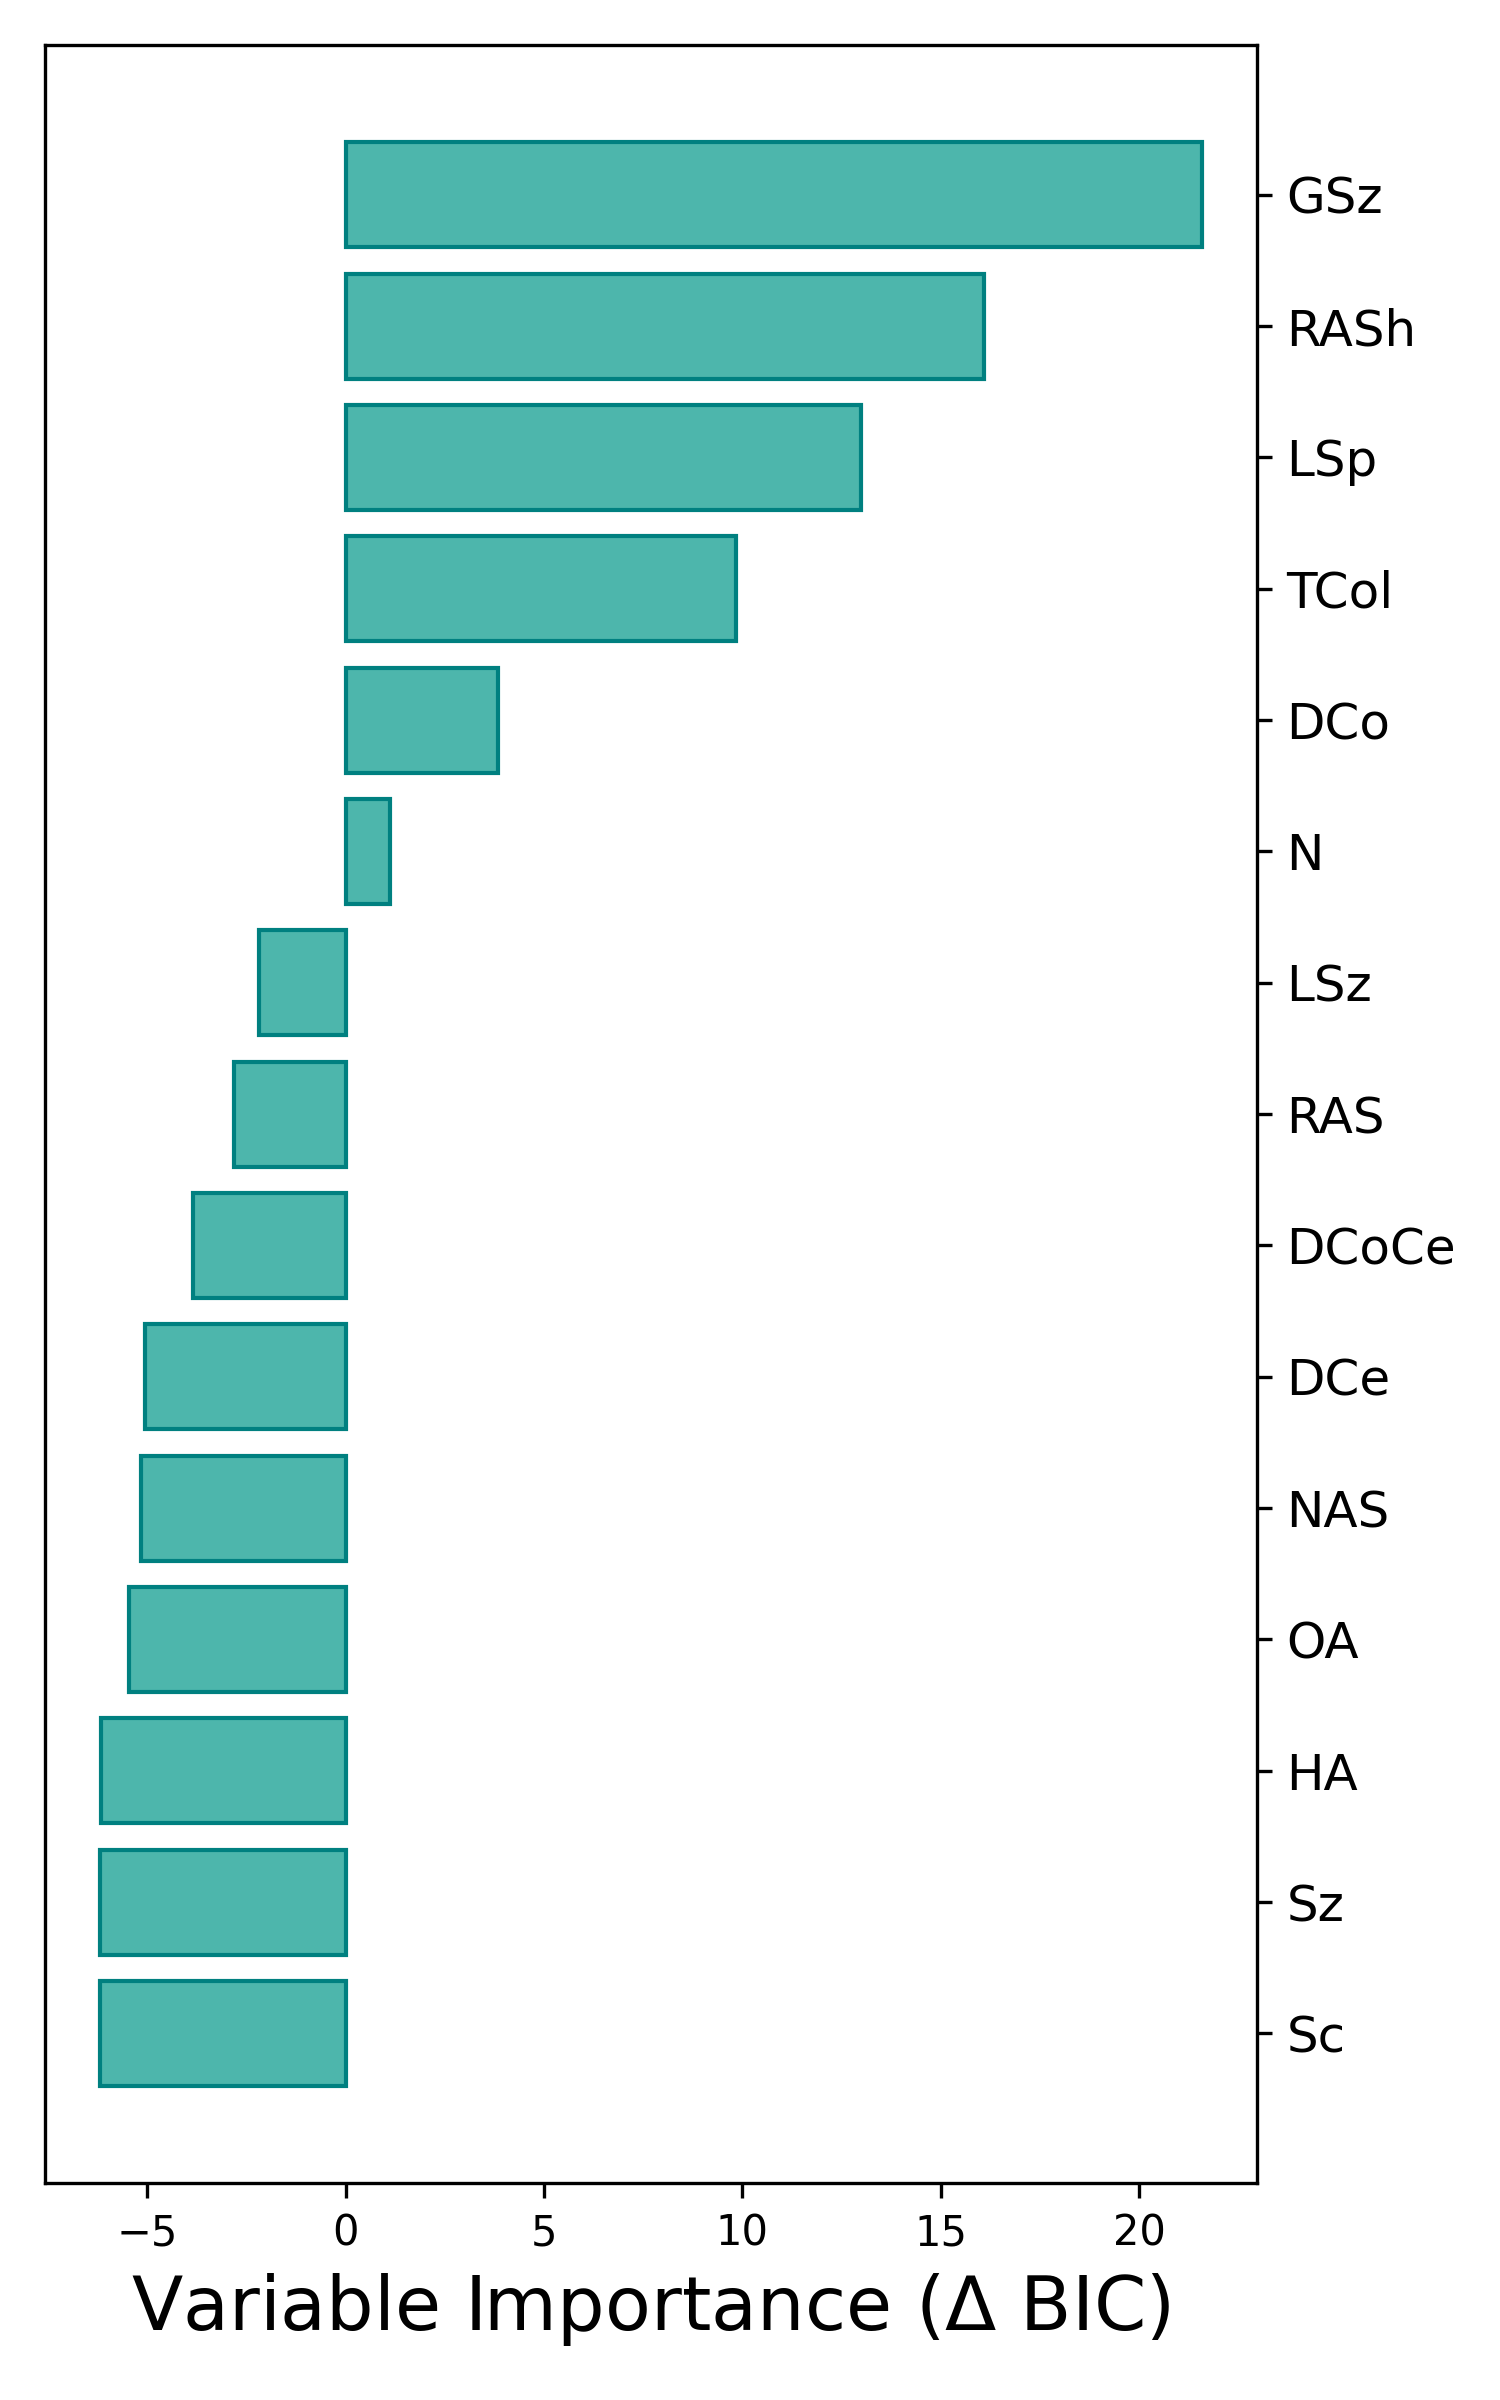
Figure 3.3: Variable importance based on difference in BIC between best model including and excluding the variable