Chapter 4 Other versions of the datasets
4.1 First responders vs the rest (My version of Lena’s dataset)
When comparing the first responding fish (FR) with the rest that can see the stimulus (SRL, NRL-r and NRL-nr), the dataset consists of ‘responders’(106 fish) and ‘non-responders’ (144 + 340 + 1375 = 1859 fish).
4.1.1 Input models
For this dataset, the best fitting model for the decision function was the same as for the ‘personal information’ dataset, but the model was only able to explain 33% of the data (pseudo-R2 = 0.33).
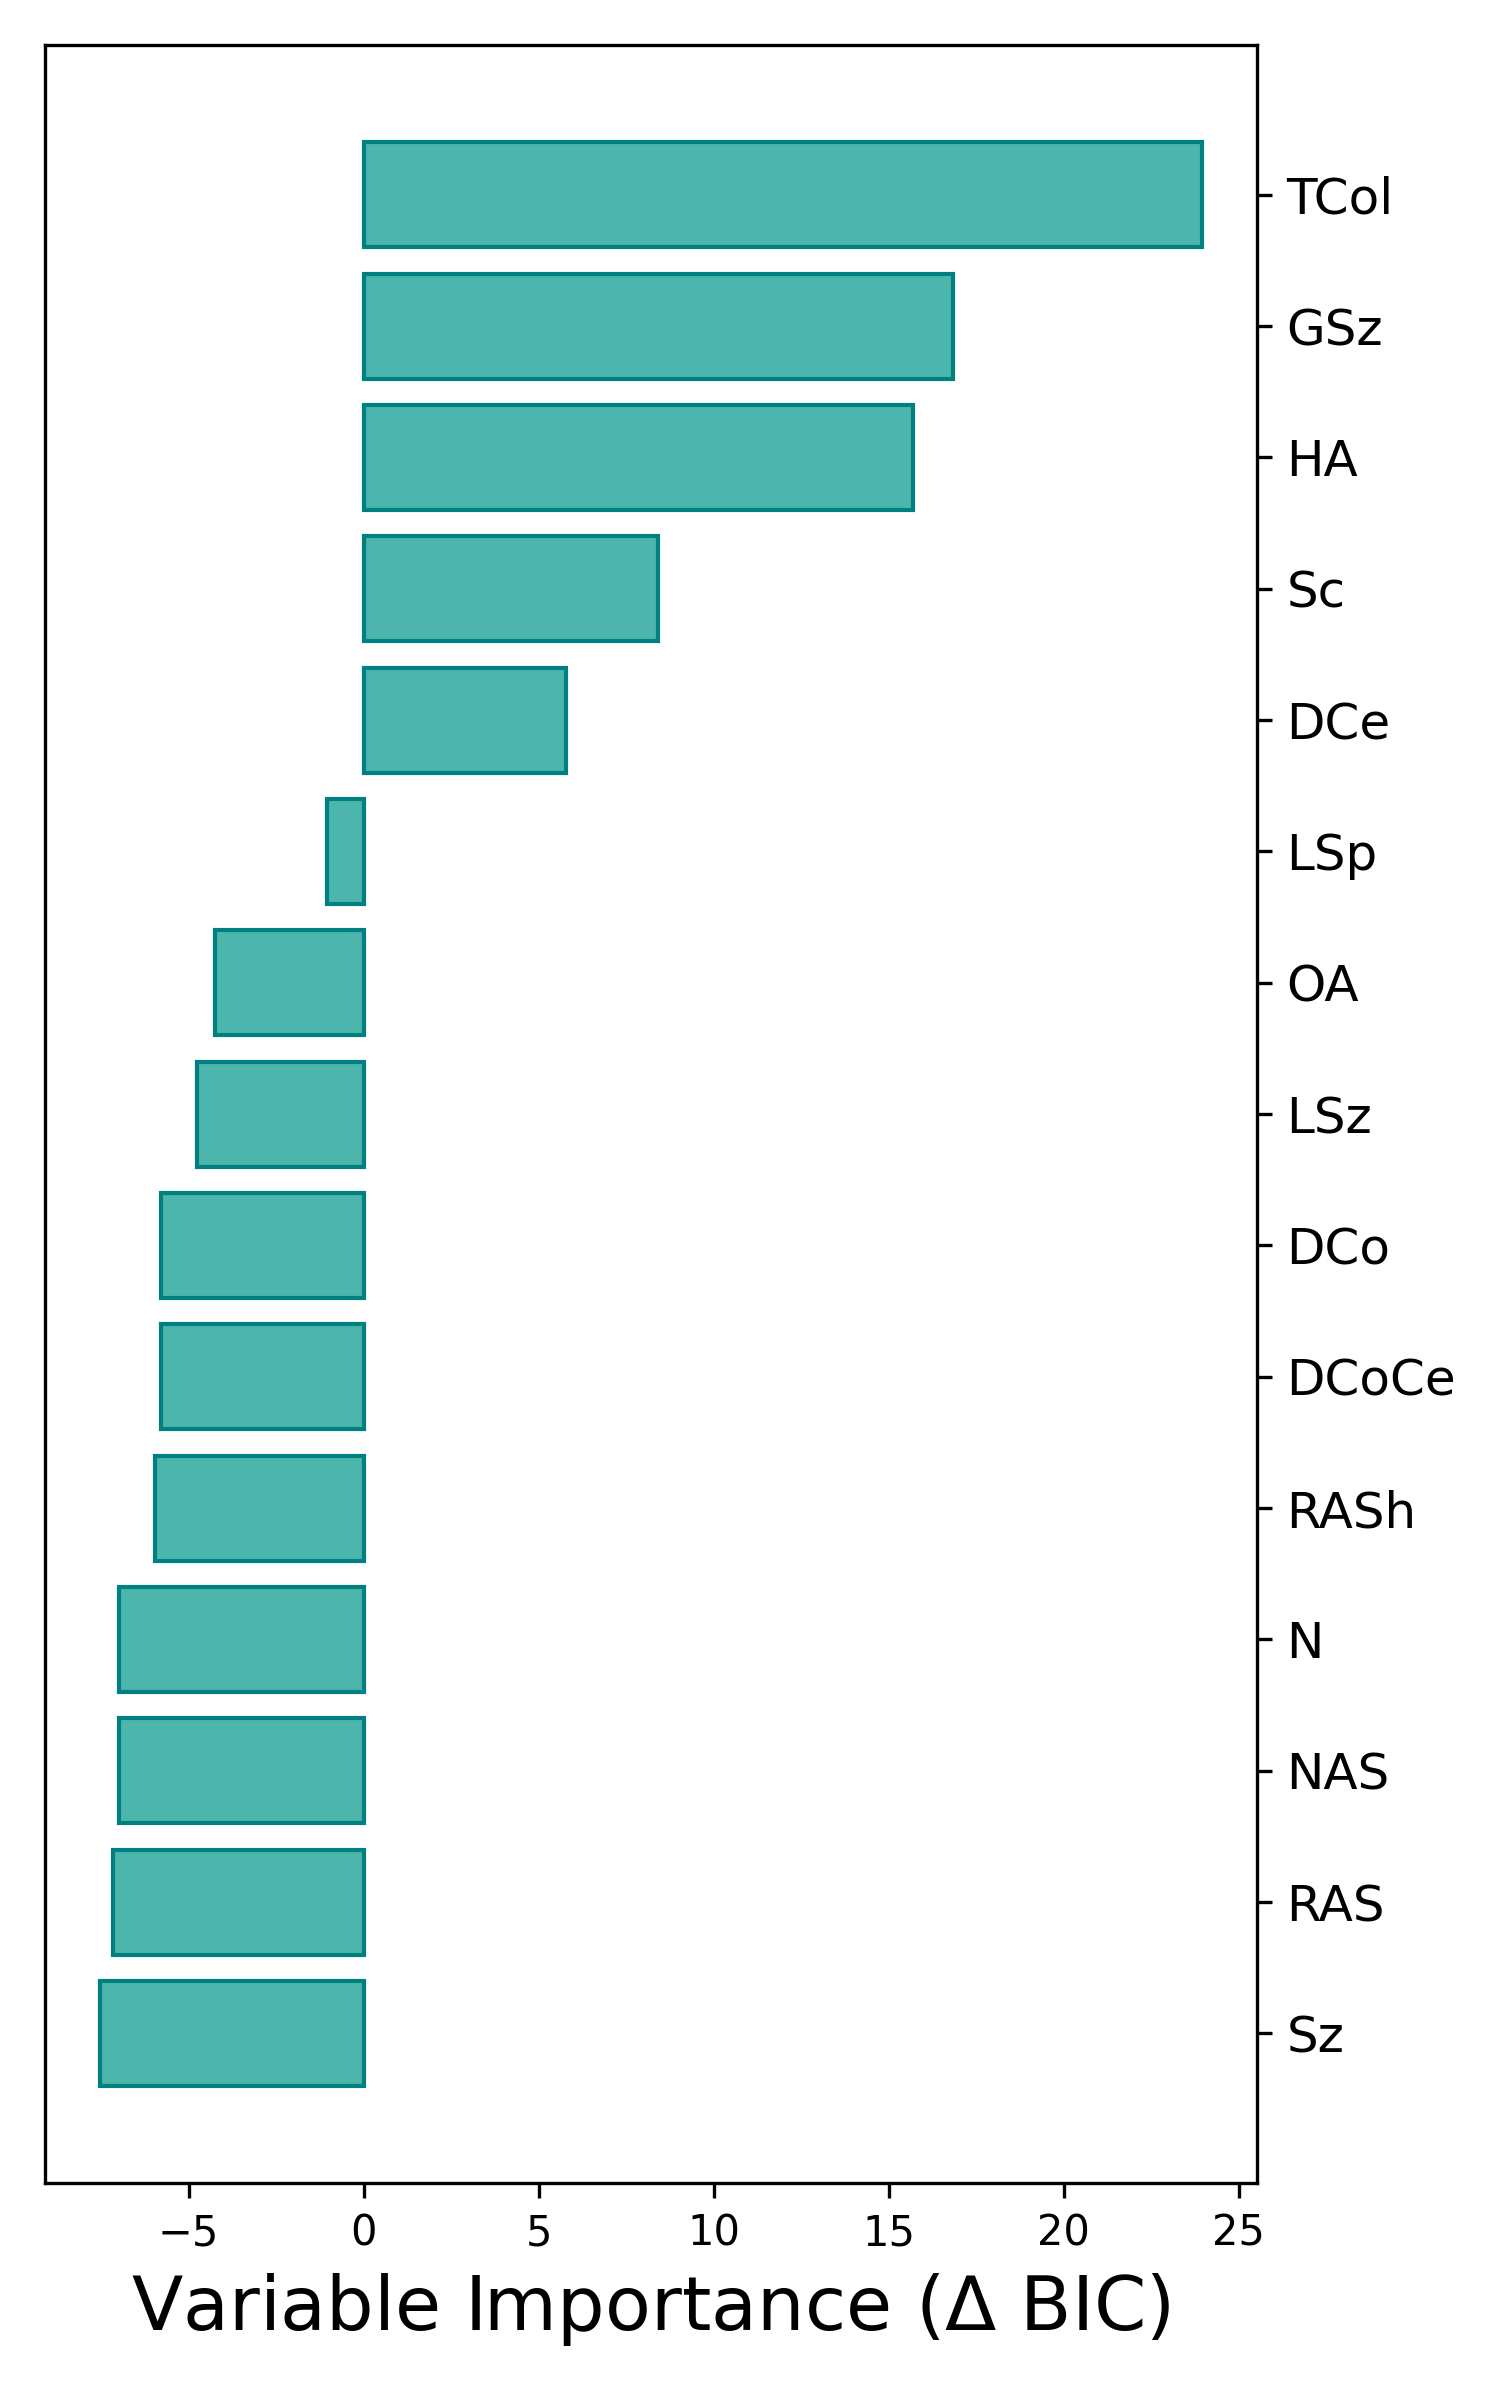
\[ D = \delta_{Sc} - HA - DCe - TCol - GSz \] In this decision function, all variables excepts the Species-type ‘Other’ have a negative influence on the response probability.
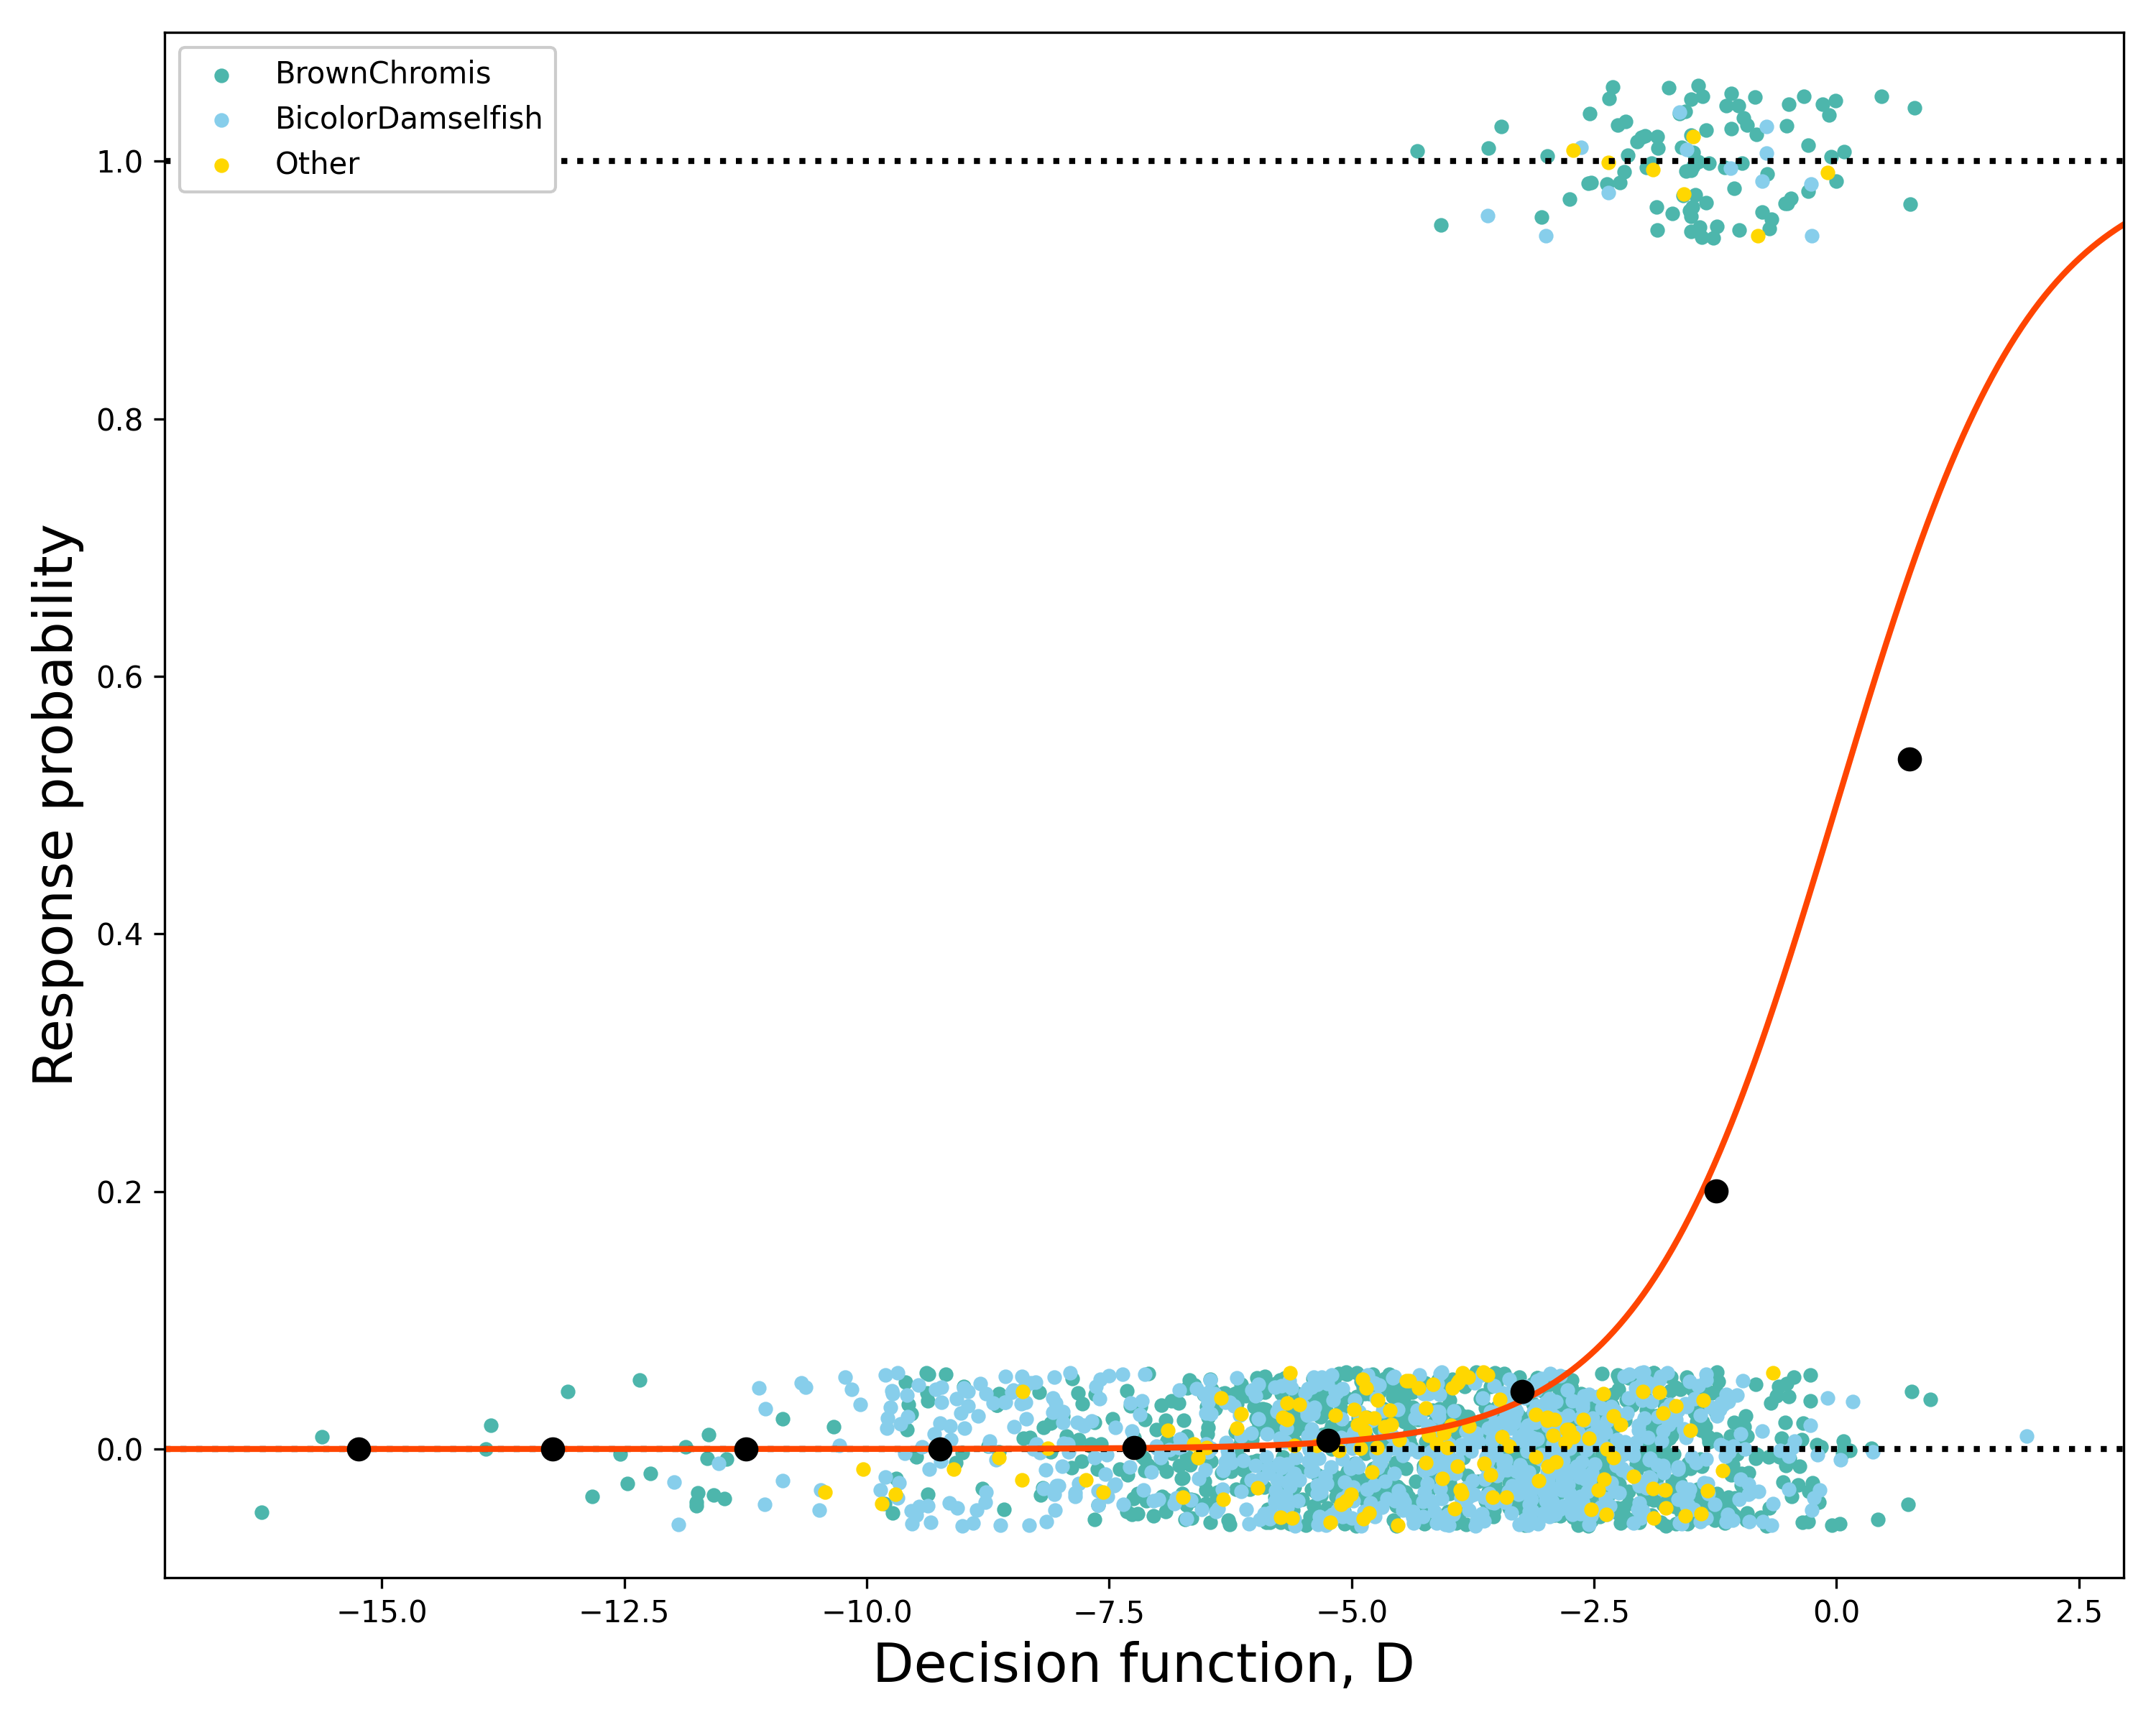
Figure 4.1: Observed binary response data coloured by species type, empirical response probabilities (black points) and predicted response probability based on equation 1 (orange line)