


Multimedia Pivot Tables: Video showing its functionality
This video demonstrates many of the functionalities of the Multimedia Pivot Tables an analytics solution for working with large collections of images. The Multimedia Pivot Tables are and integral part of the Mediatable system which also has components for a tabular visualization as well as a pointcloud viewer which allows to look at the distribution of two variables attached as metadata to the images (e.g. geocoordinates, concepts or views).
Version on YouTube
Larger version with descriptions
VideoFileJournal paper
This work is accompanying the paper M. Worring, D.C. Koelma and J. Zahalka, Multimedia Pivot Tables for Multimedia Analytics on Image Collections. IEEE Transactions on Multimedia, vol 18, no 11, November 2016. Digital Library .Experimental results
In the above mentioned paper an experiment is described with four experts using our system on a set of datasets. Below is a full account of the insights gained in those experiments.The insight plot we obtained is as follows:
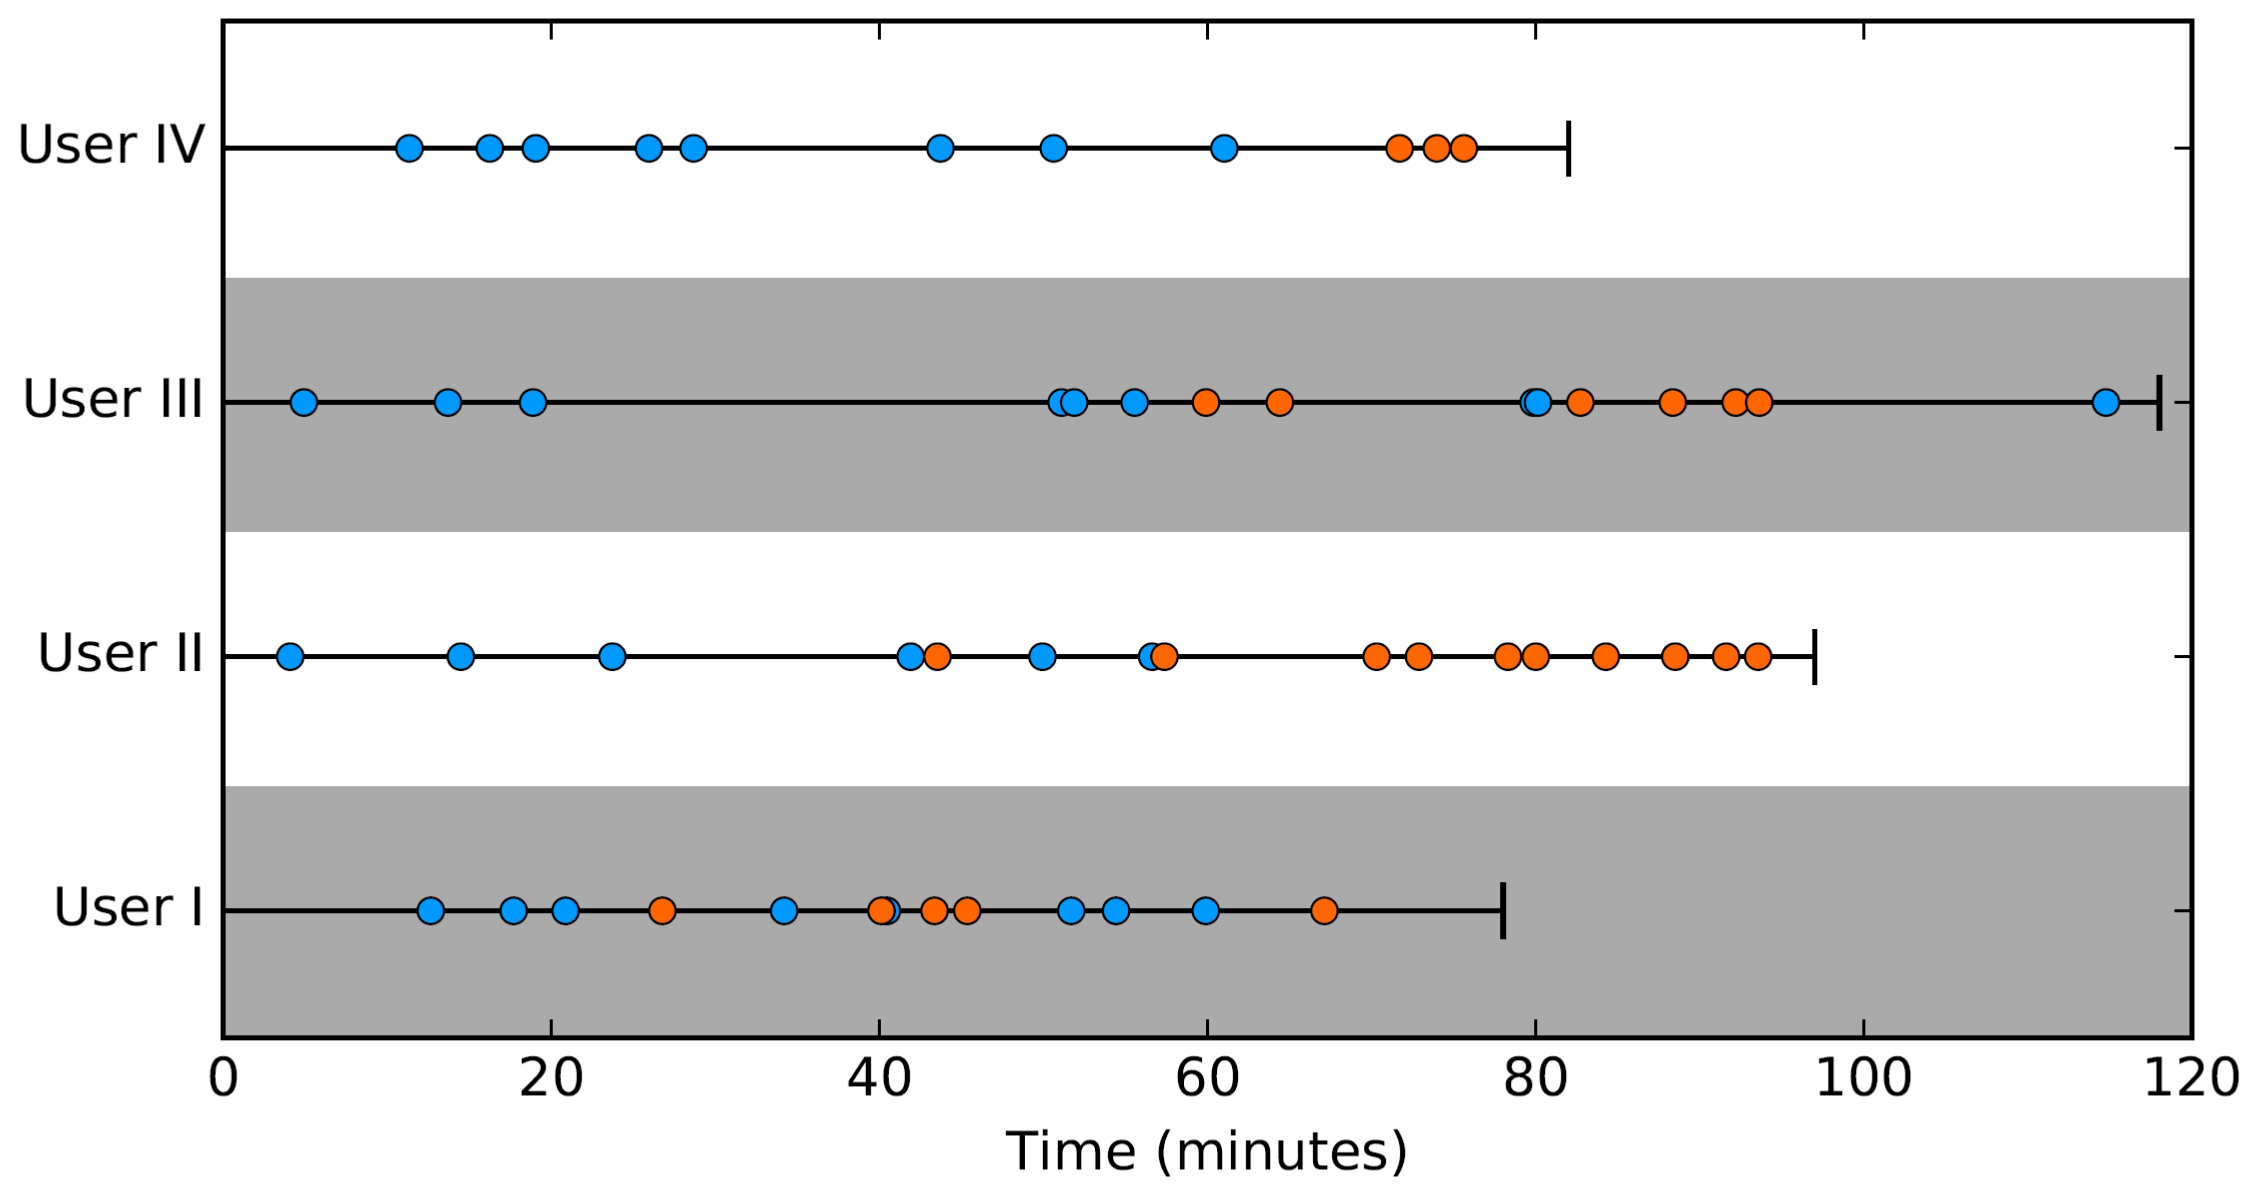
The above figure shows insight gains by experts over time. Blue dots denote structural in- sights, orange dots denote conclusive insights. Users with white background are multimedia analysis experts, users with gray background are marketing professionals
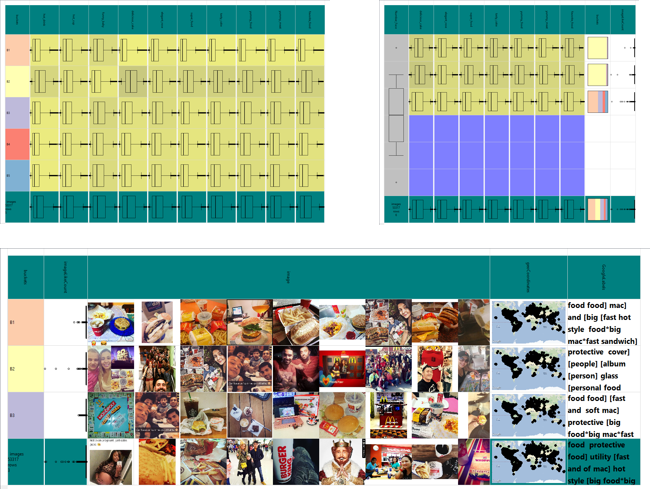
Below are some of the intermediate pivot tables used by the experts
We provide the verbatim user insights as reported by users during the expert evaluation sessions. The insight ID is in a U-T-N format, where U is the user ID (I--IV), T is the insight type (S for structural, C for conclusive) and N is the serial number. For example, II-S-4 is the fourth structural insight of user II.
- (I-S-1) 1st selection of pretty good Iamsterdam lettersets
- (I-S-2) Top 1000 selection iamsterdam
- (I-S-3) Iamsterdam outside of Museumplein (base top 1000)
- (I-C-1) Museumplein still gets a very prominent place: confusion between Rijksmuseum and Amsterdam CS?
- (I-S-4) Most commented iamsterdam pictures ($>$30 comments)
- (I-C-2) Interesting that none of these shows the Iamsterdam letterset!
- (I-S-5) Most liked iamsterdam pictures ($>$150 likes)
- (I-C-3) Only 9/34 have Iamsterdam letterset
- (I-C-4) Canal images are the most popular (liked)
- (I-S-6) Canal images
- (I-S-7) Not canals
- (I-S-8) Iamsterdam letterset high confidence.
- (I-C-5) Slightly higher likes than average when iamsterdam with high confidence
- []
- (II-S-1) I noticed the "I Amsterdam" signs on several places across the city. It seems that the municipality attempts to help spread the tourists by placing them outside the main tourist zones as well. I tried to identify which proportion of images posted in Amsterdam (being apparent focus of the dataset) has a logo depicted.
- (II-S-2) I was interested in investigating tourist photos depicting a single person or several people. The photos I was looking for were "typical being there" that could be used for a personal album. Again, I was trying to see where people would make such photos more likely (e.g., Jordaan, famous landmarks, outdoor, indoor etc.).
- (II-S-3) I wanted to select "typical" images of Jordaan and canals in general. I am curious which proportion of dataset do they make. Assuming that the dataset was collected using a geo-location based strategy (i.e., it is not intentionally topic biased), it would say something about general visitor/resident interests.
- (II-S-4) First I started looking for the images of delicious steaks, mostly because I noticed a large number of "tourist-oriented" restaurants in the center serving them. I wanted to check where those are located, what proportion of the collection they make etc.
- (II-C-1) However, I could not find that many images of steaks using several strategies, so I changed the "task" to let's see all the images of food and get an insight into what people in Amsterdam are eating. Surprisingly, there were more images of healthy food than I have expected.
- (II-S-5) Here I wanted to identify images having the architecture (e.g., canal houses typical of amsterdam, new/modern architecture etc.) as the central theme.
- (II-S-6) While exploring the collection, I noticed that there are quite some images of graffiti. I was interested to find out how many of those roughly are there, where are they captured and maybe even get an insight into the neighbourhood decay across the city.
- (II-C-2) What surprised me was that most of them were aesthetically pleasing and would rather suggest skilled artists, rather than vandals.
- (II-C-3) The results of the analysis were quite interesting. Judging by the top-5 concept scores for this category, the food seems to be "Amsterdam-agnostic". In other words, while in some cities I would expect typical shots of tables and food with the famous landmarks or architecture in the background, here it does not seem to be the case. In particular, I did not expect the concept "canal" to score so low, having in mind a large number of restaurants in e.g., Jordaan.
- (II-C-4) Judging by the high values of "amsterdam" concept, the canals seem to be very typical feature of the city. I am not sure why "iamsterdam" concept scores so high here. Can it be the case that the organisation is using a large number of such images in promoting the city? Will take a closer look at that.
- (II-C-5) Why are there so many images with \#iamsterdam in the caption?
- (II-C-6) image caption and tag collection are not very helpful in pivot tables. it may be dataset specific.
- (II-C-7) using the concept amsterdam as the row variable, we confirm the assumption that the canal houses, bicycles and Rijksmuseum are very typical image of amsterdam
- (II-C-8) Setting the concept "bicycle" as weight and concept "canal" as value variable, I notice that there are many positive correlations in all 5 buckets. This further confirms our conclusion that those concepts are indeed very typical of amsterdam and often come together.
- (II-C-9) They [graffitis] seem to be somewhat spread across the city, with more of them, quite unsurprisingly, in the Damrak/Spuistraat area.
- (II-C-10) There is almost a perfect linear correlation between the concepts "amsterdam" and "iamsterdam" across the buckets. Seems that management is doing the job well.
- []
- (III-S-1) Food bucket
- (III-S-2) Face bucket
- (III-S-3) Brands bucket
- (III-S-4) Mcdonalds Bucket
- (III-S-5) Burger King Bucket
- (III-S-6) Burger King vs McDonalds Bucket
- (III-C-1) Burger King is more associated with global/Asiatic presence
- (III-C-2) Mcdonalds seems to be present at 11-2015 more than burger king.
- (III-S-7) Burger King Whopper Bucket
- (III-S-8) Mcdonalds Big Mac Bucket
- (III-C-3) There is no difference in people taking their picture with a whopper or big mac.
- (III-C-4) Whopper images have a more skewed distribution with more outliiers related to the like count per image. Big Mac images appear to be more consistent but lower in temrs of likes. The Whopper appears to have more comments and is more consistent than the big mac.
- (III-C-5) Amaro filter seems to be related specifically Big Mac.
- (III-C-6) Whopper seems to be related to Xpro filter. Perhaps the use of filters influences the comments/ likecount of the big mac/whoppers. It could make the food look delicious or horrible.
- (III-S-9) Halloween Whopper
- []
- (IV-S-1) popular posts
- (IV-S-2) popularity in region
- (IV-S-3) popularity in Australia
- (IV-S-4) popularity in Australia considering more than 100 like numbers
- (IV-S-5) Analyzing popularity of posts in 2016
- (IV-S-6) McDonald's popularity
- (IV-S-7) Faces-logo for popularity
- (IV-S-8) Effect of selected sentiments in popularity
- (IV-C-1) The existence of a face doesn't have an effect on popularity of posts in Australia.
- (IV-C-2) We can compare the effect of a face on popularity of various brands.
- (IV-C-3) The faces of girls do have an effect on the post popularity.