1.5. Image Extrapolation aka the Border Problem
In the previous section we have seen the problem of guestimating the value of a function somewhere in between the points where the image is sampled: interpolation. In this section we want to assign a value to a point that is completely outside the domain of the image (and its sampling grid).
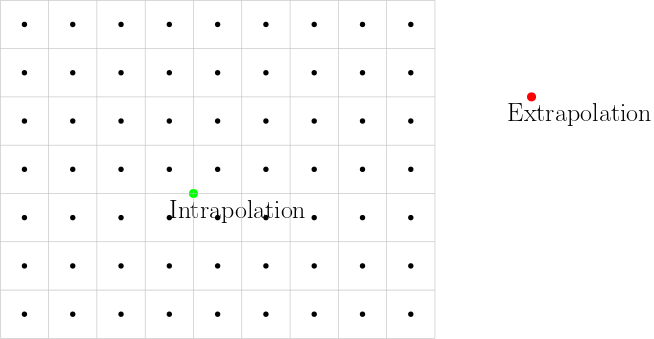
Fig. 1.15 The sample grid of an image is shown as a grid of black points. In grey the outline of the areas associated with the pixels are shown. The function value at the green point (within the grid boundaries) can be guestimated using interpolation. The function value in the red point needs an extrapolation method.
In Fig. 1.15 a small discrete (sampled) image is shown. The image function value in the green point can be calculated with an interpolation method from the previous section. The red point is completely outside the bounds of the sampling grid. An extrapolation method is needed here.
A mathematicians view on extrapolation would be to look at the trend of image function values along a (straight) path from inside the image boundaries to the red point outside the bounds. In a one dimensional situation think of the Down Jones index of the last days and the task to estimate the index a few days into the future.
In the image processing context we either
set the value of a point outside the bounds of the grid to a constant value (often zero) or,
simply pick a point that is within the bounds of the grid and use the (interpolated) value in that point.
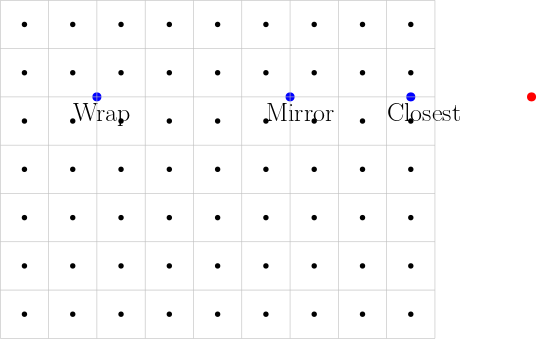
Fig. 1.16 To set a value for the red point we take the value at one of the blue points depending on the chosen ‘border mode’.
The point inside the bounds of the grid can be chosen in several different ways as depicted in Fig. 1.16:
Closest Point. We select the point inside the bounds of the grid that is closest to the red point.
Mirrored Point. We mirror the red point in the vertical line through the last sample points in horizontal direction of the grid.
Wrapping. This may seem like a very odd choice for selecting a point to represent the red point. An image is then taken to be one period (in 2d) of a periodic function (imagine a tiled wall and each tile showing the same image). As odd as it may seem, it is mathematical convenient as it is what the discrete Fourier transform implictly assumes.