5.2.14. Excercises
5.2.14.1. Equivalent Circuits
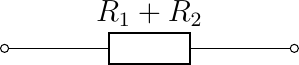
We have already seen that two resistors in series can be replaced with one resistor. Thus the circuit
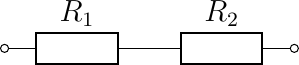
is equivalent with one resistor
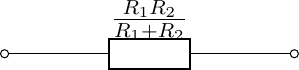
We also have that the parallel connection of two resistors:
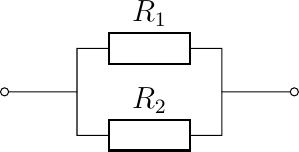
is equivalent with one resistor:
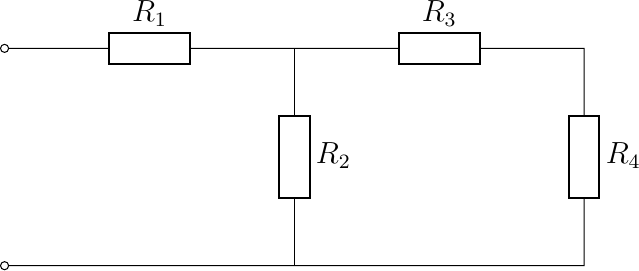
The entire circuit below can be replaced with just one resistor, what is the value of this resistor?
The same applies for the circuit below. Surpringly enough the simple series and parallel resistors tricks won’t help you out here.
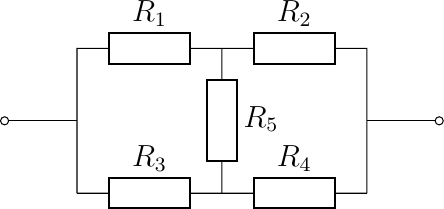
The use of the Kirchhoff laws will help you out here. Or look on the web for the \(Y-\Delta\) transformation.
5.2.14.2. Complex Impedance
If you read \(Z, Z_1\) etc. instead of \(R, R_1\) etc. in the equivalent circuits in the previous exercise then the results are perfectly useable for inductors, capacitors and combinations with resistors.
Show that the series connection of two inductors with inductances of \(L_1\) and \(L_2\) Henry is equivalent with an inductor of \(L_1+L_2\) Henry.
What is the equivalent inductance \(L\) of two inductors (\(L_1\) and \(L_2\)) connected in parallel?
What is the equivalent capacity of two capacitors connected in series?
What is the equivalent capacity of two capacitors connected in parallel?
5.2.14.3. Control Sound Level
The amplifier in your stereo system amplifies the analog signal with a small amplitude to a signal of larger amplitude and more power to drive your speakers.
At home i have a set of speakers connected to the amplifier i the living room and a second set of speakers in the kitchen connected to the same amplifier. Works great but unfortunately the speakers in the kitchen need less energy (lower amplitude) to generate the same sound level as the speakers in the living room. So either the music in the kitchen is too loud or the music in the living room is too soft.
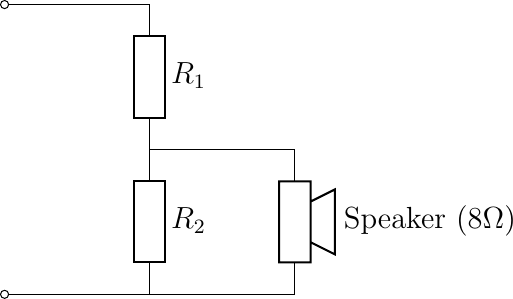
To make sound levels equal in both areas we can use a simple voltage divider as depicted here. The voltage \(u_1\) is from a source (the amplifier) measured at the input terminals on the left.
Calculate the voltage \(u_2\) (over the speaker) in terms of \(u_1\), \(R_1\) and \(R_2\). The speaker itself can be seen as a resistor and should be taken into account.
Keep in mind that the amplifier is build to expect a load of about \(8 \Omega\). How would you choose \(R_1\) and \(R_2\) such that \(u_2 = u_1/3\) and the load for the amplifier is still about \(8 \Omega\).
5.2.14.4. Bode Diagram
The international way to pronounce Bode is ‘Bodee’ but mr Bode was a dutch gentlemen so we can call him ‘Boduh’.
In previous sections we have sketched the transfer function on logarithmic scales. We have plotted \(|H(\w)|\) as a function of \(\w\).
Redo these plots but this time plot \(|H(f)|\) as a function of \(f\) where \(f\) is the frequency in Hz.
Augnents these plots with the phase plot \(\angle H(f)\) as a function of \(f\). Note that \(f\) is still plotted on a logarithmic scale but the phase on a linear scale.
5.2.14.5. Design 2-way X-over
Now consider the task of designing a cross-over filter for a two way speaker system. Both drivers, the woofer and the tweeter, are 8 \(\Omega\). Again a cross-over frequency of around 2 kHz is required. We will use the simple filters as discussed in previous sections. Plot in one figure the magnitude of the frequency response of the low-pass \(H_L(\omega)\) and high-pass \(H_H(\omega)\) filters.
Also plot the magnitude of their sum (note: first adding then taking the magnitude). In case of ideal speakers (none of them are in reality of course) you want a perfect constant total frequency response. Is that what you get?
At this webpage you find a calculator for two way x-over design. You can check your design using the calculator and setting the crossover type to “1st order Butterworth” (not quite as in a Butterworth filter the corner frequencies for the low and high pass filter are not precisely equal but close enough in practice).
Use the calculator to design a 1st order filter using the “Solen Split” setting. What are the corner frequencies for the high and low pass filters in this case?
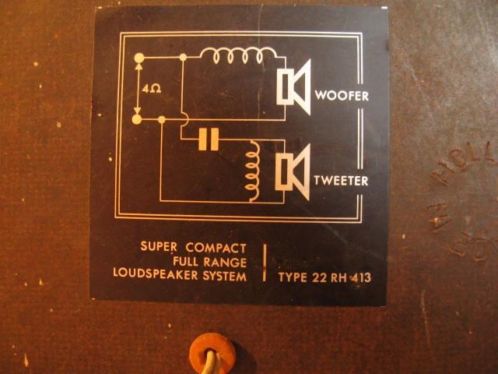
Let’s return to the Philips x-over filter. Their high-pass filter is not quite what we have done before. They have added an inductor parallel to the driver.
Calculate the frequency response of the high pass filter (assuming an inductance \(L\) and capacitance \(C\) in the high pass filter). Make a Bode plot of the magnitude. What is the corner frequency and what is the decay in dB per octave?
5.2.14.6. RIAA Correction
I still play vinyl records that i collected in the days CD’s were non existing (and no, there was no streaming music in those days because there was no digital music and there was no internet …).
As you know vinyl records store music in an analog form. The grooves in the record encode the changing sound pressure. The needle follows the groove and will start to vibrate. This vibration (movement) of the needle makes a magnet move with respect to a coil (or the other way round if you have a deep pocket) and induce a voltage that is propertional to the sound level.
We won’t go into any of the nice details like:
how do you encode the left and right sound signals using just one needle (see nice animation), and
how do you get the grooves in the record in the first place, and
how do you deal with the fact that the record is spinning at the same speed and thus the length of groove the needle travels in one second depends on whether the needle is at the start or the end of the record,
and other nasty practical problems. One problem we do look it in this exercise is the fact that low frequencies tend to be close to the mechanical eigen vibrations of the needle system. To much low frequencies would throw the needle out of the groove. Therefore the RIAA system was developed. Before the audio signal is transformed into grooves on the record the signal is filtered. Low frequencies are attenuated. But then when the needle follows the groove and you would not correct the sound signal you would hear a sound with too much high frequency content. So we have increase the low frequencies and decrease the high frequencies. There are a lot of ways to make such a filter. Here we discuss a simple (very simple..) analog filter using a few passive components. We only give a mono version.
In order to restore the original sound signal we need to filter the signal coming from the record player using the RIAA decoding curve. A passive filter to do this is sketched:
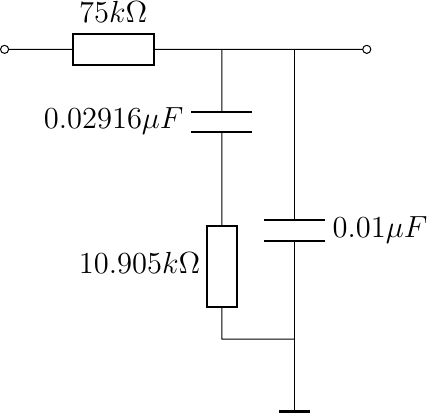
Calculate the complex transfer function (symbolic math allowed).
Plot the frequency response of this passive filter (both amplitude as well as phase).
Search for the RIAA response curve on the web and compare it with your calculated curve (be aware that there are two curves: one for recording sound on the record and one for reconstructing the original sound, this exercise is about the latter curve).
5.2.14.7. Non Inverting OpAmp
Consider the following opamp circuit. \(u_o/u_i\).
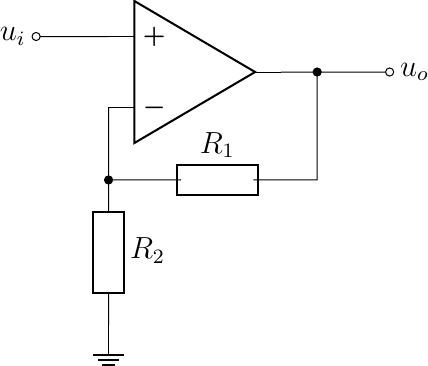
Calculate the amplification \(u_o/u_i\) assuming an ideal op amp.
Explain that replacing either one of the resistors by a capacitor is not going to lead to a stable frequency response. An intuitive explanation looking at the behaviour of a capacitor at low and high frequencies suffices.
5.2.14.8. Sallen Key opamp filter
In the section on active filters a Sallen-Key high-pass filter is given.
Starting from the transfer function of a generic Sallen-Key filter prove the expressions for \(H(s)\) for the high-pass filter.
Can you make a first order low-pass filter by a clever choice of the resistor and capacitor values starting from the generic Sallen-Key filter?
Show that replacing a resistor with a capacitor and vice versa will change the high-pass filter into a low-pass filter.
5.2.14.9. Audio Equalizer
In an audio system it is sometimes nice to be able to change the frequency response of the system: to increase or decrease the response to certain frequencies in the signal. That is where an audio equalizer comes in. An audio equilizer for instance can increase the bass response (to compensate a bit for the small speaker enclosures you own) or compensate for strange frequency dips or peaks that are introduced by your room acoustics. A typical analog equalizer from the previous century looked a bit like shown in the figure below.
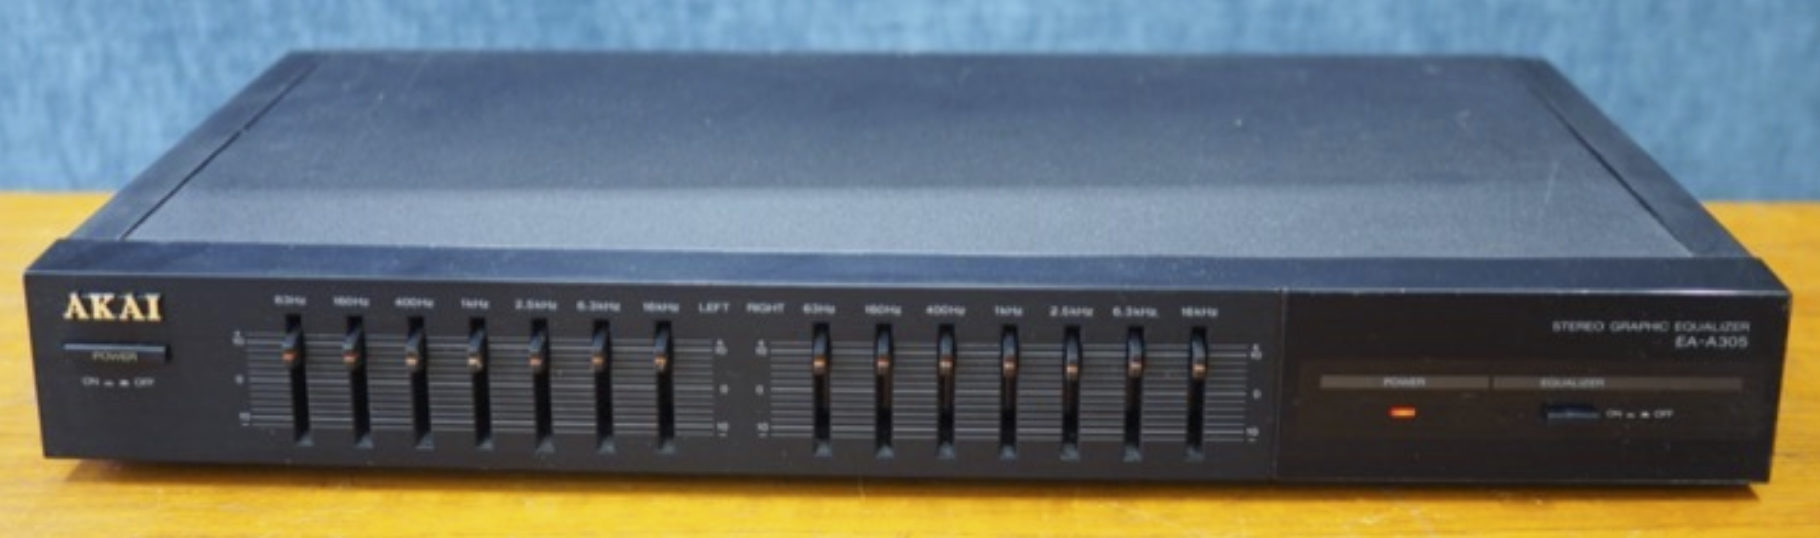
Fig. 5.32 Analog Audio Equalizer. The are 7 potentiometers for the left and right audio channels. Each of the 7 potentiometers influences a band of frequencies. Note that the potentiometers are all set in the top position (so all frequency bands are boosted) something that defeats the purpose of an audio equalizer.
A typical circuit for an audio equalizer (only 2 bands are shown instead of the 7 bands as shown in the figure) is given in the figure below.
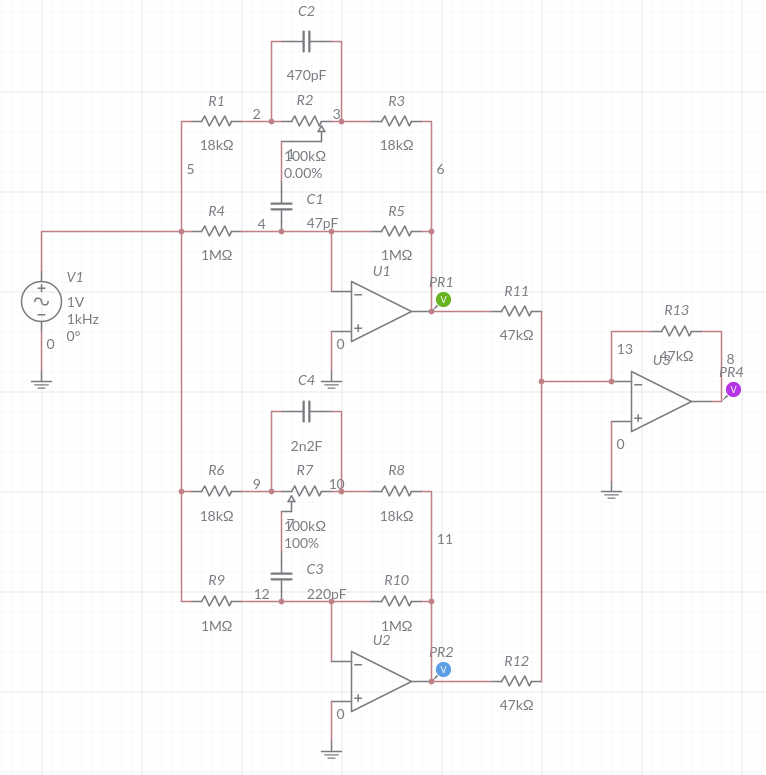
Fig. 5.33 Circuit for Two bands of an audio equalizer.
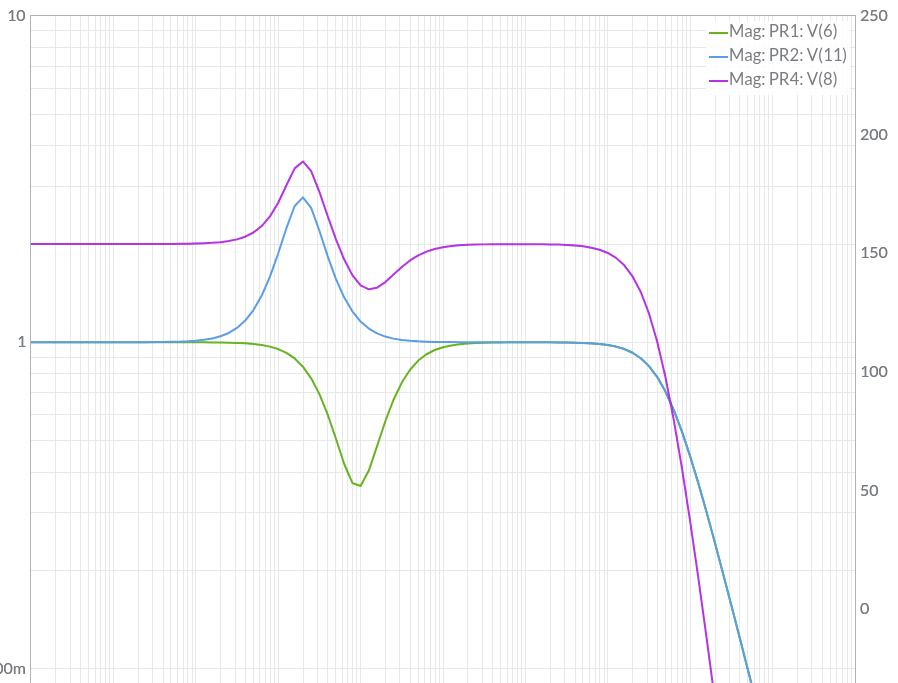
Fig. 5.34 Response of the two band audio equalizer. The colors of the curves correspond with the colors of the probe in the previous figure.
Nowadays a lot of audio processing is done digitally. The figure below shows the GUI for the equalizer that is availabel in pulseeffects that makes a lot of audio effects available in the pulseaudio framework on linux.
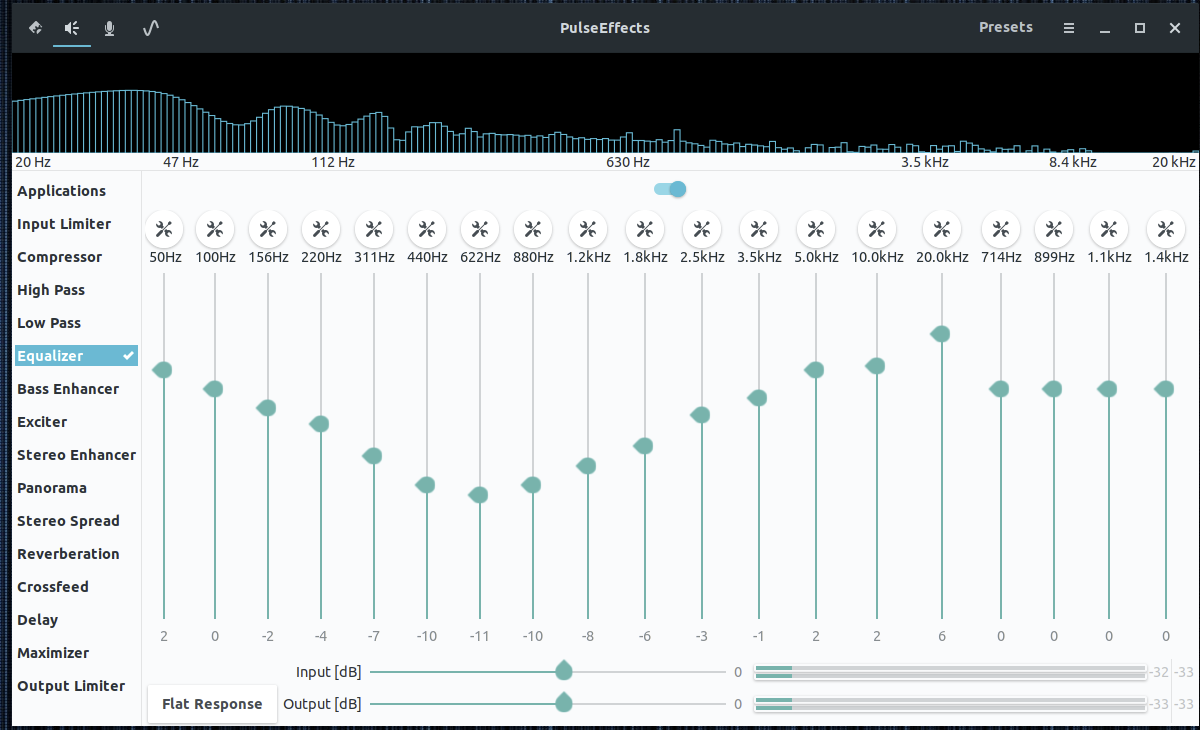
Fig. 5.35 Digital Audio Equalizer. Shown is the user interface of the digital audio equalizer to be used in the pulseaudio framework on linux systems.
Find a possible implementation for such an equalizer on the web. Calculate the frequency response of one band and implement (at least) one band using Python (need not be a real time filter).
Note: there is no (not yet) solution for this exercise!