5.3.3. Exercises
Sampling.
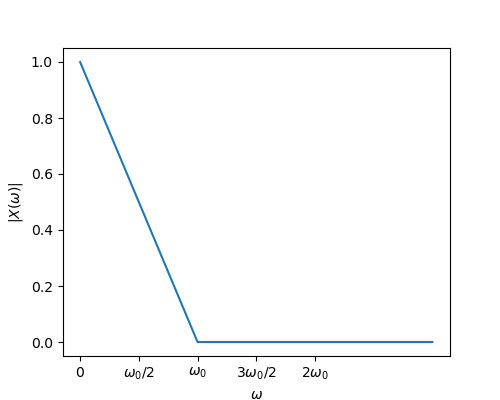
Consider a real valued and even function \(x(t)\) with a Fourier spectrum \(|X(\w)|\) as sketched below.
Show code for figure
 1import numpy as np
 2import matplotlib.pyplot as plt
 3
 4plt.clf()
 5
 6w0 = 2
 7w = np.linspace(0, 6, 100)
 8X = np.maximum(0, 1-w/w0)
 9
10plt.gcf().set_size_inches(5, 4)
11plt.plot(w, X)
12plt.xticks([0, 1, 2, 3, 4], [r'$0$', r'$\omega_0/2$',
13   r'$\omega_0$', r'$3\omega_0/2$', r'$2\omega_0$'])
14plt.xlabel(r'$\omega$')
15plt.ylabel(r'$|X(\omega)|$')
16plt.savefig('source/figures/Xexample_sampling.png')
Why is it that \(X(\w)\) is even and real valued?
Sketch \(X(\w)\) for \(-4\w_0\leq\w\leq 4\w_0\).
Let \(X_s\) be the spectrum of the ‘sampled’ signal \(x_s\):
\[x_s(t) = x(t) p_{\Delta t}(t)\]where \(p_{\Delta t}\) is the (infinite length) pulse train with period \(\Delta t\) corresponding with the chosen sample frequency.
Sketch \(X_s\) for sampling frequency \(\w_s=2\w_0\).
Sketch \(X_s\) for sampling frequency \(\w_s=3\w_0/2\).