7.3. Real Time Processing Sound Signals
First we add a plot of the powerspectrum of the FFT of the sound signal. In the figure below a screenshot is shown of Miles Davis. The typical pattern of harmonics (frequency spikes at constant interval) of a wind instrument are shown (remember the clarinet exercise).
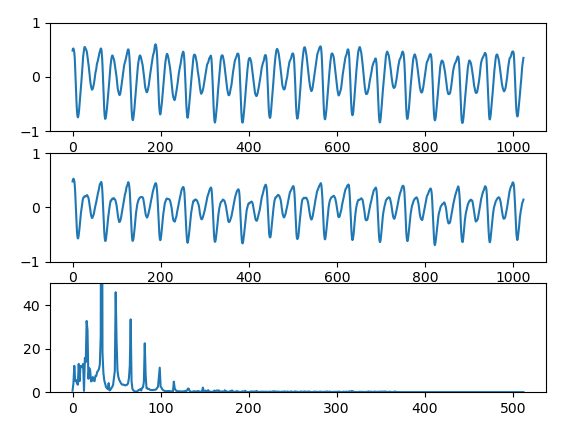
Fig. 7.2 Screenshot of the real time audio visualization.
import soundfile as sf
import pyaudio
import numpy as np
import matplotlib.pyplot as plt
import time
from scipy.fft import rfft

plt.close('all')
plt.ion()

FILE = "../../data/sowhat.wav"

chunk = 1024 #  should be even!
pa = pyaudio.PyAudio()

f = sf.SoundFile(FILE)

is_stereo = f.channels == 2
if is_stereo:
    fig, axs = plt.subplots(nrows=3, ncols=1)
    xleftline, = axs[0].plot(np.arange(chunk), np.zeros(chunk), '-')
    axs[0].set_ylim([-1,1])
    xrightline, = axs[1].plot(np.arange(chunk), np.zeros(chunk), '-')
    axs[1].set_ylim([-1,1])
    absFline, = axs[2].plot(np.arange(chunk//2+1), np.zeros(chunk//2+1), '-')
    axs[2].set_ylim([0,50])
else:
    fig, axs = plt.subplots(nrows=2, ncols=1)
    xmonoline, = axs[0].plot(np.zeros(chunk), np.zeros(chunk), '-')
    axs[0].set_ylim([-1,1])
    absFline, = axs[1].plot(np.arange(chunk//2+1), np.zeros(chunk//2+1), '-')
    axs[1].set_ylim([0,50])

plt.show(block=False)


def callback(in_data, frame_count, time_info, status):
    fsx = f.read(chunk, dtype='float32')
    if is_stereo:
        xleft = fsx[:,0]
        xright = fsx[:,1]
        xleftline.set_ydata(xleft)
        xrightline.set_ydata(xright)
        absFline.set_ydata(np.abs(rfft(xleft)))
    else:
        xmono = fsx
        xmonoline.set_ydata(xmono)
        absFline.set_ydata(np.abs(rfft(xmono)))
    return (fsx.tobytes(), pyaudio.paContinue)


stream = pa.open(format=pyaudio.paFloat32,
                 channels=f.channels,
                 rate=f.samplerate,
                 frames_per_buffer=chunk,
                 output=True,
                 stream_callback=callback)


stream.start_stream()
start_time = time.time()
duration = 120

while stream.is_active() and time.time() - start_time < duration:
    # time.sleep(0.1) # just waiting for the stream to finish
    fig.canvas.draw()
    fig.canvas.flush_events()


stream.stop_stream()
stream.close()

pa.terminate()
plt.close('all')
print('done')
Observe that for each processed block of data an FFT is calculated. Quite some work to be done by the processor.
In the second example we implement a digital low pass filter to process the stream of audio data. Both left and right channel are filtered in case of a stereo signal. Observe that the ‘high hat’ on the drums is barely heard now.
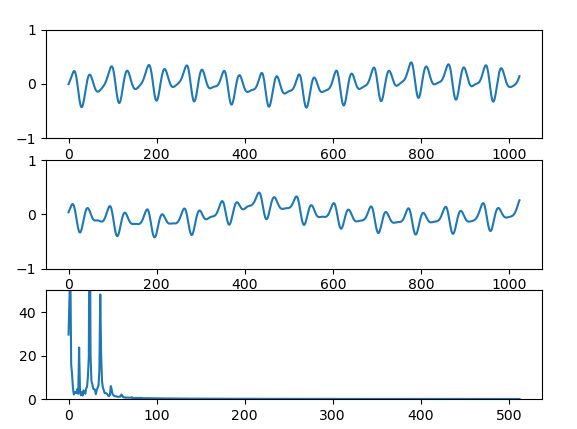
Fig. 7.3 Screenshot of the real time audio visualization of a low pass filtered signal. Observe that in comparison with the unfiltered signal we have lost some of the higher frequency harmonics of Miles’ trumpet.
import soundfile as sf
import pyaudio
import numpy as np
import matplotlib.pyplot as plt
from matplotlib.widgets import RadioButtons
import time
from scipy.fft import rfft
from scipy.signal import butter, lfiltic, lfilter

plt.close('all')
plt.ion()

FILE = "../../data/sowhat.wav"

chunk = 1024 #  should be even!
pa = pyaudio.PyAudio()

f = sf.SoundFile(FILE)

is_stereo = f.channels == 2
if is_stereo:
    fig, axs = plt.subplots(nrows=3, ncols=1)
    xleftline, = axs[0].plot(np.arange(chunk), np.zeros(chunk), '-')
    axs[0].set_ylim([-1,1])
    xrightline, = axs[1].plot(np.arange(chunk), np.zeros(chunk), '-')
    axs[1].set_ylim([-1,1])
    absFline, = axs[2].plot(np.arange(chunk//2+1), np.zeros(chunk//2+1), '-')
    axs[2].set_ylim([0,50])
else:
    fig, axs = plt.subplots(nrows=2, ncols=1)
    xmonoline, = axs[0].plot(np.zeros(chunk), np.zeros(chunk), '-')
    axs[0].set_ylim([-1,1])
    absFline, = axs[1].plot(np.arange(chunk//2+1), np.zeros(chunk//2+1), '-')
    axs[1].set_ylim([0,50])

fig.subplots_adjust(left=0.3)
rax = fig.add_axes([0.05, 0.7, 0.15, 0.15])
rax.set_title("listen to:")
radio = RadioButtons(rax, {'original', 'filtered'})

original = True

def radiofunc(label):
    global original
    print(label)
    if label=='original':
        print("original")
        original = True
    else:
        original = False
        print("filtered")

radio.on_clicked(radiofunc)

butterworth_order = 4
filterb, filtera = butter(butterworth_order, 1500, btype='lowpass', fs=f.samplerate)
print(filtera)
print(filterb)
filterzi = np.zeros((butterworth_order, f.channels))
print(filterzi)

def callback(in_data, frame_count, time_info, status):
    global filterzi
    global original

    fsx = f.read(chunk, dtype='float32')
    fsy, filterzi = lfilter(filterb, filtera, fsx, axis=0, zi=filterzi)

    if original:
        fsy = fsx
    else:
        fsy = fsy.astype(np.float32)  #  Grrr filter returns float64...

    if is_stereo:
        xleft = fsy[:,0]
        xright = fsy[:,1]
        xleftline.set_ydata(xleft)
        xrightline.set_ydata(xright)
        absFline.set_ydata(np.abs(rfft(xleft)))
    else:
        xmono = fsy
        xmonoline.set_ydata(xmono)
        absFline.set_ydata(np.abs(rfft(xmono)))
    return (fsy.tobytes(), pyaudio.paContinue)


stream = pa.open(format=pyaudio.paFloat32,
                 channels=f.channels,
                 rate=f.samplerate,
                 frames_per_buffer=chunk,
                 output=True,
                 stream_callback=callback)


stream.start_stream()
start_time = time.time()
duration = 2*60

while stream.is_active() and time.time() - start_time < duration:
    # time.sleep(0.1) # just waiting for the stream to finish
    fig.canvas.draw()
    fig.canvas.flush_events()


stream.stop_stream()
stream.close()

pa.terminate()
plt.close('all')
print('done')